
If your sales team rejects more than half of the leads marketing sends over, the problem is not sales being too picky. It is that your scoring model is not filtering for fit and intent. Industry data shows that approximately 87% of MQLs are rejected by sales teams as unqualified—a staggering waste of pipeline resources. The root cause in most cases is a scoring model built on form-fill behavior rather than actual buying signals.

Most B2B teams lose 40–60% of qualified prospects to broken handoffs and weak qualification. Take our 2-minute diagnostic to find out where your pipeline is bleeding — and how to fix it.
Start the Quiz → Takes 2 minutes. No email required to start.This guide builds a practical ICP scoring framework you can implement this quarter, explains where traditional lead scoring falls short, and shows how intent-weighted scoring changes the economics of your entire sales pipeline.
Why ICP Scoring Matters More Than Lead Scoring
Lead scoring and ICP scoring are related but different. Lead scoring typically measures engagement: Did the prospect open an email? Download a whitepaper? Attend a webinar? These signals indicate interest but not fit. A junior analyst at a 10-person startup can download every whitepaper you publish and still never become a customer.
ICP scoring measures fit: Does this account match the profile of companies that actually buy, succeed with, and renew your product? It evaluates attributes like company size, industry, technology stack, growth stage, and geographic presence—characteristics that are predictive of long-term customer value, not just short-term engagement.

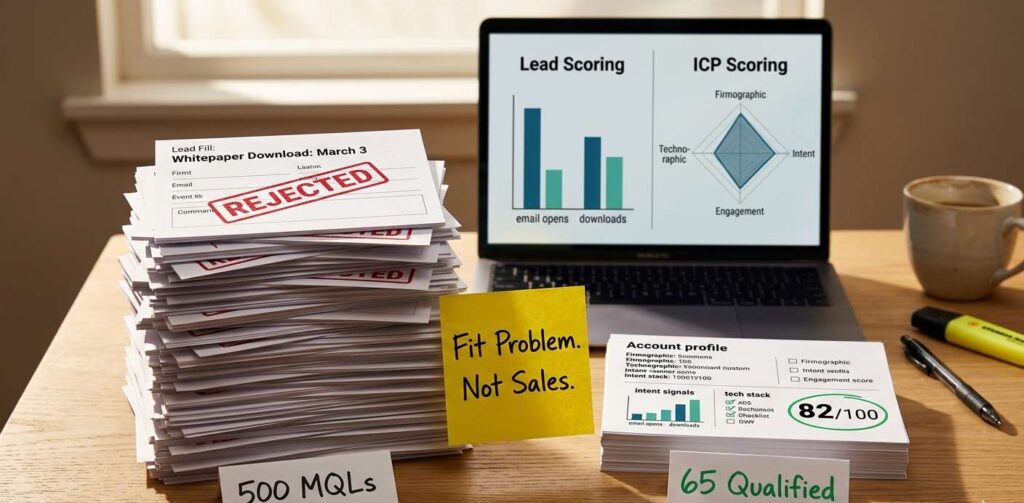
The most common failure mode in B2B marketing is scoring exclusively on engagement and ignoring fit. When marketing celebrates “500 MQLs this month” but sales only accepts 65 of them as qualified, the gap is almost always a fit problem, not an engagement problem. Sales and marketing alignment starts with agreeing on what “qualified” means—and that definition must include ICP fit.
The Four Pillars of a B2B ICP Scoring Model
A comprehensive ICP scoring model evaluates four categories of attributes. Each category carries a weighted point allocation that sums to 100 points total.

Pillar 1: Firmographic Fit (30 Points)
Firmographic attributes describe the company itself. These are the most stable and predictive indicators of whether an account belongs in your pipeline.
Company Size (10 pts): Employee count and/or annual revenue. If your product sells to mid-market companies with 200–2,000 employees, a Fortune 50 enterprise and a 5-person startup both score low—for different reasons. Define the sweet spot and score highest for exact match.
Industry Vertical (10 pts): Which industries have the highest win rates and lowest churn in your existing customer base? Score based on historical performance data, not assumptions. If you close 40% of SaaS deals but only 12% of manufacturing deals, SaaS gets a 10 and manufacturing gets a 3.
Geography (5 pts): Relevant if your product has regional constraints (compliance, language, support hours) or if your sales team has geographic specialization.
Growth Stage (5 pts): Series B SaaS companies buying their first sales stack behave differently from established enterprises replacing a legacy vendor. Score based on which growth stage aligns with your product’s value proposition.
Pillar 2: Technographic Fit (20 Points)
Technographic data reveals what technology a company already uses, which predicts both compatibility with your product and propensity to buy.
Tech Stack Compatibility (10 pts): Does the prospect use the platforms your product integrates with? If your tool requires Salesforce and the prospect runs HubSpot, that’s a fit issue that will surface during evaluation. Score based on integration readiness.
Competitive Displacement Signals (10 pts): Is the prospect using a competitor’s product, and are there signals that they’re unhappy with it? Job postings for roles that suggest a technology transition, negative reviews, or contract renewal dates all indicate displacement opportunity. Score highest for accounts actively evaluating alternatives.
Pillar 3: Intent Signals (30 Points)
This is where most scoring models fail—and where the largest opportunity lies. Intent signals measure what a prospect is actively researching, which is a stronger predictor of buying behavior than firmographic fit alone.
Content Consumption (15 pts): Is the prospect engaging with content related to your solution category? First-party intent data—signals from your own website, media properties, or content platforms—is significantly more reliable than third-party intent data purchased from aggregators. When a VP of Sales reads three articles about pipeline optimization on a publication you own, that signal is verified, specific, and recent.
DemandNexus generates first-party intent signals from six owned B2B media brands (AITechTrend, MarTechTrend, HRTechTrend, FinTechFilter, LegalTechTrend, DevTechTrend) that collectively reach over 15 million decision-makers monthly. This proprietary data feeds directly into ICP scoring models, providing a layer of behavioral intelligence that bought data cannot replicate.
Research Velocity (10 pts): A prospect who read one article six months ago is different from a prospect who read five articles in the past two weeks. Recency and frequency of engagement are critical velocity signals. Score highest for accounts showing accelerating research patterns within a 30-day window.
Topic Alignment (5 pts): Not all intent is equal. A prospect reading about “what is CRM” is in a different stage than one reading “CRM migration checklist.” Score based on how closely the research topics align with late-stage buying behavior.
Pillar 4: Engagement Signals (20 Points)
Engagement measures direct interaction with your brand—not as a replacement for fit and intent, but as a complementary signal.
Website Behavior (8 pts): Pricing page visits, demo page visits, case study downloads, and return visits are all high-value engagement signals. Score based on the commercial intent of the pages visited, not just visit frequency.
Direct Interaction (7 pts): Has the prospect responded to an email, attended a webinar, or engaged in a conversation? Direct interaction combined with high fit + intent scores is the strongest possible buying signal.
Multi-Threading (5 pts): Multiple people from the same account engaging with your content or attending your events is a buying committee signal. Score higher when two or more contacts from the same account are active.
Not sure if your scoring model is filtering the right leads? Take the free DemandNexus Pipeline Assessment Quiz.
Static ICP Scoring vs. Intent-Weighted ICP Scoring
Traditional ICP scoring is static: it evaluates firmographic and technographic attributes that rarely change. A company’s size, industry, and tech stack are relatively stable—which makes static scoring a useful baseline but a poor predictor of buying timing.
Intent-weighted ICP scoring adds a dynamic layer. A company might score 75/100 on static fit criteria, but if they’re not actively researching your category, they’re not ready to buy. Conversely, a company that scores 60/100 on fit but is showing strong intent signals right now may represent a better near-term opportunity than the higher-fit account that isn’t in-market.
The practical implication: intent-weighted scoring reshuffles your target account list continuously. Instead of working a static list of 500 accounts in alphabetical order, your SDRs work the 50 accounts that have the highest composite score today—and that list updates as intent signals change.
This approach transforms outreach from calendar-based cadence (“we touch every account every two weeks”) to signal-based engagement (“we touch accounts when they’re showing buying behavior”). The result is dramatically higher sales prospecting efficiency.
The Waterfall Layer: ICP → BANT → AHO
ICP scoring is the first filter in a multi-stage qualification process. It determines which accounts are worth pursuing. But fit alone does not mean an opportunity is sales-ready.
The Waterfall qualification model used by DemandNexus adds two additional layers after ICP scoring:
BANT verification: Once an ICP-qualified prospect engages, a human SDR conducts a structured BANT qualification call to verify Budget, Authority, Need, and Timeline. This is not a robotic checklist—it’s a consultative conversation that probes for specifics and scores each element on a 1–5 scale.
AHO delivery: If the prospect passes BANT verification (minimum 4.0 average score), the SDR produces an Appointment Handover Sheet (AHO)—a structured document delivered to the AE 24–48 hours before the meeting containing BANT scores, verbatim quotes, competitor intelligence, objections, and a recommended approach.
The three-layer model—ICP fit → BANT verification → AHO handover—is why teams using this approach report 60%+ SQL conversion rates compared to the 13% industry median for standard MQL handoffs. The qualification failure that causes the 87% MQL rejection problem is eliminated not by one filter, but by three working in sequence.
Want to see what intent-weighted ICP scoring looks like in practice? Book a strategy call with DemandNexus.
Building Your Scoring Model: A Step-by-Step Process
Step 1: Analyze your best customers. Pull your top 20 customers by revenue, retention, and NPS. What do they have in common? This is your empirical ICP—not a guess, but a pattern from data.
Step 2: Weight the four pillars. If your product has strong integration requirements, weight technographic fit higher. If your market is highly competitive, weight intent signals higher. The 30/20/30/20 split suggested above is a starting point—adjust based on what predicts conversion in your data.
Step 3: Set scoring thresholds. Define what score qualifies an account for outreach (e.g., 65+), what qualifies for SDR engagement (e.g., 75+), and what qualifies for AE meeting (e.g., 85+ with BANT verification).
Step 4: Instrument the data. Map each scoring attribute to a data source. Firmographic data comes from your CRM or enrichment tools. Technographic data from platforms like BuiltWith or HG Insights. Intent data from your own media properties or a first-party intent provider. Engagement data from your marketing automation platform.
Step 5: Test, learn, adjust. Run the scoring model for one quarter. Compare scores against actual conversion outcomes. Adjust weights based on what predicts revenue, not just pipeline volume.
The scoring model should be reviewed quarterly and recalibrated annually. Markets shift, buyer behavior changes, and your product evolves—your scoring model needs to evolve with it.
Common ICP Scoring Mistakes
Scoring on title alone. A VP title does not equal buying authority. Score on role in the buying process, not just seniority.
Over-weighting engagement. Engagement without fit produces MQLs that sales rejects. Keep engagement as a complementary signal, not the primary driver.
Ignoring negative scoring. Competitors, partners, students, and job seekers should receive negative scores that exclude them from the qualified pool. Without negative scoring, your highest-scored leads may include people who will never buy.
Using third-party intent as a primary signal. Third-party intent data is aggregated, delayed, and shared with your competitors. It is useful as a supplementary signal but unreliable as a primary scoring input. First-party intent—from your own content, events, and media properties—is proprietary, real-time, and verified.
Setting static thresholds. A scoring model that never changes becomes irrelevant. Build recalibration into your quarterly planning process.
Calculate the revenue impact of moving from form-fill scoring to intent-weighted qualification.
FAQs
What is an ideal customer profile in B2B sales?
An ideal customer profile (ICP) is a detailed description of the type of company most likely to buy your product, get value from it, and become a long-term customer. It includes firmographic attributes (size, industry, geography), technographic attributes (tech stack, platforms), and behavioral signals (content consumption, research activity). Unlike buyer personas, which describe individuals, ICPs describe companies.
What criteria should be in a B2B ICP scoring model?
A comprehensive ICP scoring model includes four categories: firmographic fit (company size, industry, geography, growth stage), technographic fit (tech stack compatibility, competitive displacement signals), intent signals (content consumption, research velocity, topic alignment), and engagement signals (website behavior, direct interaction, multi-threading). Each category is weighted and scored on a point scale to produce a composite qualification score.
How is ICP scoring different from lead scoring?
Lead scoring measures individual engagement (email opens, downloads, webinar attendance) and is typically activity-based. ICP scoring measures account-level fit against your ideal customer attributes. A prospect can score high on lead engagement but low on ICP fit—meaning they’re interested but unlikely to become a successful customer. The best qualification systems use both: ICP scoring to filter for fit, and engagement scoring as a supplementary timing signal.
How do you score B2B sales leads?
Assign point values across four categories: firmographic fit (30 points), technographic fit (20 points), intent signals (30 points), and engagement signals (20 points). Score each attribute within the category, sum them for a total out of 100, and set thresholds for different actions (e.g., 65+ for outreach, 75+ for SDR engagement, 85+ with BANT verification for AE meeting). Review and recalibrate quarterly based on conversion data.
What is a good lead score threshold?
The optimal threshold depends on your market and sales capacity. A common starting point is 65–70 out of 100 for initial outreach eligibility, 75–80 for SDR qualification engagement, and 85+ with verified BANT criteria for an AE meeting. The key is to set the threshold based on conversion data from your own pipeline, not an industry average—then adjust quarterly as your scoring model matures.