
The pipeline is distinct from the sales process (which is the seller’s workflow) and the sales funnel (which is the buyer’s journey). The pipeline is a management and forecasting tool. This guide covers how to structure pipeline stages, set conversion benchmarks, calculate velocity, and avoid the vanity metrics that make pipelines look healthy while revenue targets are missed.

Most B2B teams lose 40–60% of qualified prospects to broken handoffs and weak qualification. Take our 2-minute diagnostic to find out where your pipeline is bleeding — and how to fix it.
Start the Quiz → Takes 2 minutes. No email required to start.Six Pipeline Stages with Conversion Benchmarks
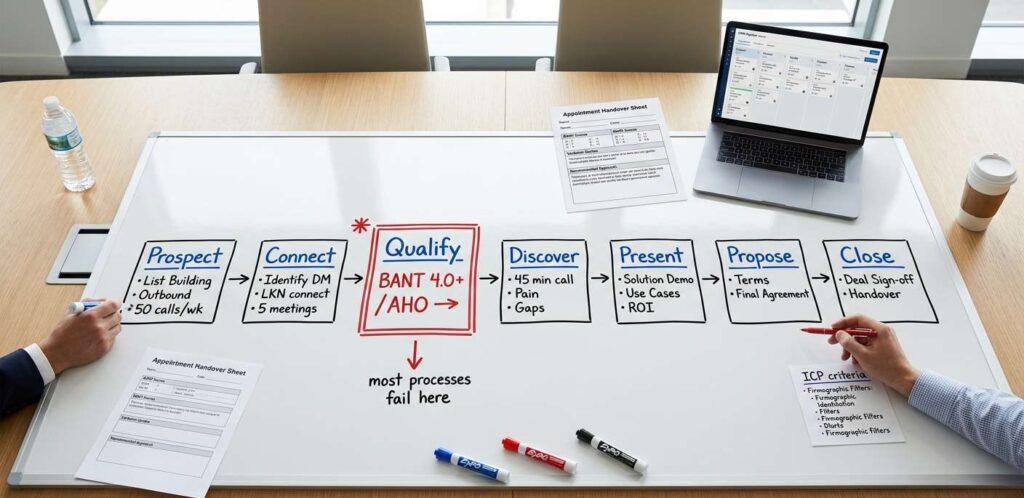
Stage 1: Qualified Lead (SQL)
An SQL is a prospect who has passed your qualification criteria and been accepted by the AE for a meeting. This is the entry point to the pipeline. If your qualification process is rigorous—using BANT verification with documented scoring—the quality of SQLs entering the pipeline will be high. If your qualification is loose, everything downstream suffers.
Benchmark: MQL-to-SQL acceptance rate should be 40–60% if marketing and sales are aligned on qualification criteria. If sales accepts fewer than 30% of MQLs, the problem is likely a scoring model that prioritizes engagement over fit. If acceptance exceeds 70%, your qualification threshold may be too low.
Stage 2: Discovery Completed
The AE has conducted a discovery call, validated the qualification data, and confirmed mutual interest in exploring the solution. The prospect’s pain points, buying process, and evaluation criteria are documented.

Benchmark: 85–95% of SQLs should complete discovery if qualification was thorough. If you’re losing more than 15% at this stage, either no-shows are high (a qualification quality problem) or the AE is discovering disqualifying information that should have been caught earlier.
Stage 3: Demo/Presentation Delivered
The prospect has seen a tailored demonstration of the solution. The demo addressed their specific pain points (not a generic product tour) and involved relevant stakeholders from the buying committee.

Benchmark: 70–85% of completed discoveries should advance to demo. Drop-off at this stage often indicates that the discovery uncovered complexity or misalignment that the qualification stage missed.
Stage 4: Proposal Sent
A formal proposal with pricing, scope, timeline, and terms has been delivered. The prospect has reviewed it and either accepted, requested modifications, or entered negotiation.
Benchmark: 60–75% of demos should result in a proposal. If proposal rates are below 50%, the demo may not be connecting the solution to the prospect’s specific pain points, or pricing expectations are misaligned.
Stage 5: Negotiation/Legal Review
Terms are being finalized. Procurement, legal, and security reviews may be in progress. This stage has the highest variance in duration—it can take days or months depending on the organization’s approval process.
Benchmark: 75–90% of proposals should advance through negotiation to close. Significant drop-off here usually indicates deal-level issues: competing priorities, budget freezes, or stakeholder changes.
Stage 6: Closed-Won / Closed-Lost
The deal has reached its conclusion. Closed-Won means revenue is booked. Closed-Lost means the opportunity did not convert—and the reason should be documented for pipeline analysis.
Overall benchmark: A healthy B2B pipeline converts 15–25% of SQLs to Closed-Won. Teams using verified qualification (intent data + BANT + AHO) consistently report SQL-to-Close conversion rates above 30%, because the quality of pipeline entry is dramatically higher than teams relying on volume-based MQL handoffs.
Calculate what verified pipeline quality would be worth to your team.
Pipeline Velocity: The Formula That Predicts Revenue
Pipeline velocity measures how quickly revenue moves through your pipeline. The formula is: (Number of SQLs) x (Average Deal Value) x (Win Rate) ÷ (Average Sales Cycle Length in Days) = Pipeline Velocity (revenue per day).
Each variable in the formula represents a lever. You can increase velocity by generating more qualified SQLs, increasing deal size through upsell or cross-sell, improving win rate through better qualification and sales execution, or shortening the sales cycle through faster qualification and decision-making.
The most impactful lever for most teams is win rate, because it is the variable most directly influenced by qualification quality. A team that doubles its win rate from 15% to 30% doubles its pipeline velocity without generating a single additional SQL or closing a single larger deal. And the primary driver of win rate improvement is ensuring that only genuinely qualified opportunities enter the pipeline in the first place.
The 3:1 Pipeline Coverage Myth
Conventional wisdom says you need 3x pipeline coverage to hit your revenue target—if your quota is $1M, you need $3M in pipeline. This rule of thumb assumes a roughly 33% win rate, which is accurate for average B2B teams.
But the 3:1 ratio is a symptom, not a law. It reflects the reality that most B2B pipelines are filled with poorly qualified opportunities. If your win rate is 15% (common for teams relying on MQL volume), you actually need 6–7x coverage. If your win rate is 40% (achievable with verified qualification), you need only 2.5x coverage.
This has profound resource implications. A team that needs 7x coverage to hit quota must generate seven times more pipeline than they close, which means more SDR headcount, more marketing spend, and more AE time wasted on meetings that were never going to close. A team that needs 2.5x coverage allocates those same resources to fewer, higher-quality opportunities and still hits the same number.
Pipeline Hygiene: Keeping Your Forecast Honest
Age limits: Set maximum age thresholds by stage. If a deal has been in “Proposal Sent” for 60 days with no movement, it should be moved to Closed-Lost or pushed back to an earlier stage. Stale deals inflate pipeline reports and corrupt forecasts.
Next-step verification: Every deal in the pipeline should have a confirmed next step with a date. If an AE can’t articulate the next step for a deal, the deal isn’t real, it’s hope.
Close-date accuracy: Track how often close dates slip. If close dates are regularly pushed by 30+ days, your pipeline stages aren’t reflecting reality. Frequent close-date slippage is a leading indicator of forecasting failure.
Regular pipeline reviews: Weekly pipeline reviews with the sales manager force accountability and surface problems early. The review should focus on stage-appropriate questions: for early-stage deals, “Is the prospect qualified?”; for late-stage deals, “What is the path to signature?”
See what a pipeline built on verified qualification looks like.
FAQs
What are the stages of a B2B sales pipeline?
A typical B2B sales pipeline includes six stages: (1) Qualified Lead (SQL), (2) Discovery Completed, (3) Demo/Presentation Delivered, (4) Proposal Sent, (5) Negotiation/Legal Review, and (6) Closed-Won or Closed-Lost. Each stage has defined exit criteria that an opportunity must meet before advancing to the next stage.
What is a healthy B2B sales pipeline?
A healthy pipeline has balanced stage distribution (no single stage contains more than 40% of total deals), consistent conversion rates between stages, accurate close dates, active next steps for every deal, and overall SQL-to-Close conversion of 15–25% (or 30%+ for teams using verified qualification). The pipeline should generate enough weighted revenue to cover 2.5–3x your quota.
How do you calculate sales pipeline velocity?
Pipeline velocity = (Number of SQLs) × (Average Deal Value) × (Win Rate) ÷ (Average Sales Cycle Length in Days). This produces a revenue-per-day figure that represents how quickly your pipeline generates closed revenue. Improving any variable improves velocity, but win rate improvement through better qualification typically has the highest leverage.
What is the difference between a sales pipeline and a sales funnel?
A sales pipeline represents your team’s active deals organized by stage—it is a management and forecasting tool. A sales funnel represents the buyer’s journey from awareness through purchase—it is a marketing and conversion optimization framework. The pipeline is seller-centric; the funnel is buyer-centric. In practice, pipeline stages map to the later stages of the funnel (consideration through decision).
How much pipeline do I need to hit quota?
The required pipeline coverage depends on your win rate. At a 33% win rate (industry average), you need 3x coverage. At 20% win rate, you need 5x. At 40% win rate (achievable with verified qualification), you need only 2.5x. Calculate your specific coverage ratio by dividing your revenue target by your historical win rate.