

This guide gives you the complete framework for ABM metrics that actually map to sales funnel outcomes — from the first intent signal to a closed deal. You’ll learn which KPIs matter at each stage, what benchmarks to measure against, how to build an ABM scorecard that sales and marketing agree on, and why the most successful ABM programs in 2026 have ditched vanity metrics entirely.

Most B2B teams lose 40–60% of qualified prospects to broken handoffs and weak qualification. Take our 2-minute diagnostic to find out where your pipeline is bleeding — and how to fix it.
Start the Quiz → Takes 2 minutes. No email required to start.1. Why Most ABM Metrics Fail to Reflect Sales Funnel Reality
Account-based marketing was supposed to fix the broken lead generation model. Instead of spraying content at thousands of anonymous prospects, you focus resources on a precise list of target accounts and guide them through a coordinated, multi-channel journey toward a meeting and a deal.
The theory is sound. The measurement, however, usually isn’t.
The Vanity Metric Trap
The vast majority of ABM dashboards are built around activity metrics that feel meaningful but don’t connect to revenue:

- Accounts reached (but not engaged)
- Impressions served to target accounts
- Click-through rate on sponsored content
- Email open rates from the target list
- MQLs generated from ABM-targeted accounts
The problem isn’t that these metrics are useless — it’s that they sit at the top of the funnel and tell you nothing about sales funnel progression. A CMO celebrating 85% account reach has no way of knowing whether a single one of those accounts is moving toward a purchase decision.
| ★ The Core Insight ABM is not a lead generation program. It is a sales funnel acceleration program. Your metrics must reflect movement through the funnel — not activity at the top of it. The question is never: “How many accounts did we reach?” The question is always: “How many accounts moved one stage closer to a closed deal?” |

The Funnel Disconnect
Traditional B2B marketing funnels look like this:
| Funnel Stage | What It Means for ABM |
| Traffic → Lead → MQL → SAL → SQL → Opportunity → Closed Won | Traditional Funnel (high volume, low quality) |
The problem: by the time a prospect becomes an MQL, your sales team still has to do discovery, qualification, objection handling, and relationship-building from scratch. The MQL tells you that someone engaged with content. It tells you nothing about budget, authority, need, or timeline.
According to DemandNexus research, 87% of MQLs are rejected by sales teams — most within the first conversation. The ABM program generated activity. It did not generate pipeline.
2. The ABM Metrics Framework: Funnel-Stage KPIs That Actually Matter
The right way to think about ABM metrics is to map them to the stage of the sales funnel they’re designed to measure. Each stage has distinct KPIs, distinct success benchmarks, and distinct consequences if ignored.
Stage 1: Account Targeting & Intent — Top of Funnel
At the top of the funnel, you’re asking: are the right accounts showing active buying signals? These are not vanity metrics — they’re leading indicators of pipeline potential.
| KPI | What It Measures |
| Target Account List (TAL) Coverage | % of ICP accounts you have contact-level data on |
| Intent Signal Score | Behavioral score based on content consumption, search, and media engagement |
| Account Reach Rate | % of target accounts touched by at least one channel |
| 1st-Party Content Engagement | Downloads, webinar attendance, newsletter opens from named accounts |
| Intent-to-ICP Alignment | % of high-intent accounts that match your ICP criteria (size, vertical, title) |
Benchmarks to Target
- TAL Coverage: 80%+ contact-level coverage before outreach begins
- Intent Signal Score: Prioritize accounts in top 20% of engagement
- 1st-Party Engagement Rate: 15-25% from newsletter/content syndication is strong
| Why 1st-Party Intent Data Outperforms 3rd-Party Intent
Third-party intent providers (Bombora, 6sense, ZoomInfo) sell the same signals to you AND your competitors simultaneously. Only 40-50% of those signals correspond to actual buying committees. DemandNexus generates 1st-party intent through six proprietary media brands: AITechTrend | MarTechTrend | FinTechFilter | HRTechTrend | DevTechTrend | LegalTechTrend When a VP of Risk at a bank reads 3 articles on FinTechFilter about AML automation, that is a named, real-time, proprietary signal — not an anonymous IP match. That is the difference between a guess and a qualified prospect. |
Stage 2: Awareness & Engagement — Mid-Funnel
Mid-funnel ABM metrics measure whether target accounts are not just aware of you, but actively engaging with your message in ways that signal genuine interest.
| KPI | What It Measures |
| Account Engagement Score (AES) | Composite score of all interactions from a named account |
| Multi-Touch Account Coverage | % of buying committee members engaged (not just one contact) |
| Content Consumption Depth | Avg. number of content pieces consumed per account |
| Outreach Response Rate | % of outbound sequences that generate a reply or engagement |
| Meeting Request Rate | % of engaged accounts that accept a discovery meeting |
| ABM Campaign Metrics | CTR, conversion rate, and cost-per-engagement by campaign type |
Benchmarks to Target
- Account Engagement Score: Flag accounts with 3+ interactions in 30 days for immediate SDR follow-up
- Multi-Touch Coverage: Target 2+ contacts per account in enterprise deals
- Meeting Request Rate: Context-aware outbound (referencing specific content consumed) achieves 40-50% engagement vs. 10% for cold spray
Stage 3: Pipeline Entry — Qualification Metrics
This is the most critical — and most ignored — stage of ABM measurement. The transition from “engaged account” to “qualified pipeline” is where most ABM programs either generate real revenue or generate busy work for the sales team.
| KPI | What It Measures |
| BANT Qualification Rate | % of engaged accounts that pass Budget, Authority, Need, Timeline verification |
| Appointment Set Rate | % of outreach sequences that result in a scheduled, confirmed meeting |
| Disqualification Rate | % of prospects screened out before reaching sales — higher is better |
| Cost Per Qualified Appointment | Total ABM spend / number of BANT-verified meetings scheduled |
| Account-to-Opportunity Conversion Rate | % of scheduled meetings that become active pipeline opportunities |
| Decision-Maker Meeting Rate | % of scheduled meetings where a confirmed budget holder attends |
The BANT Qualification Benchmark
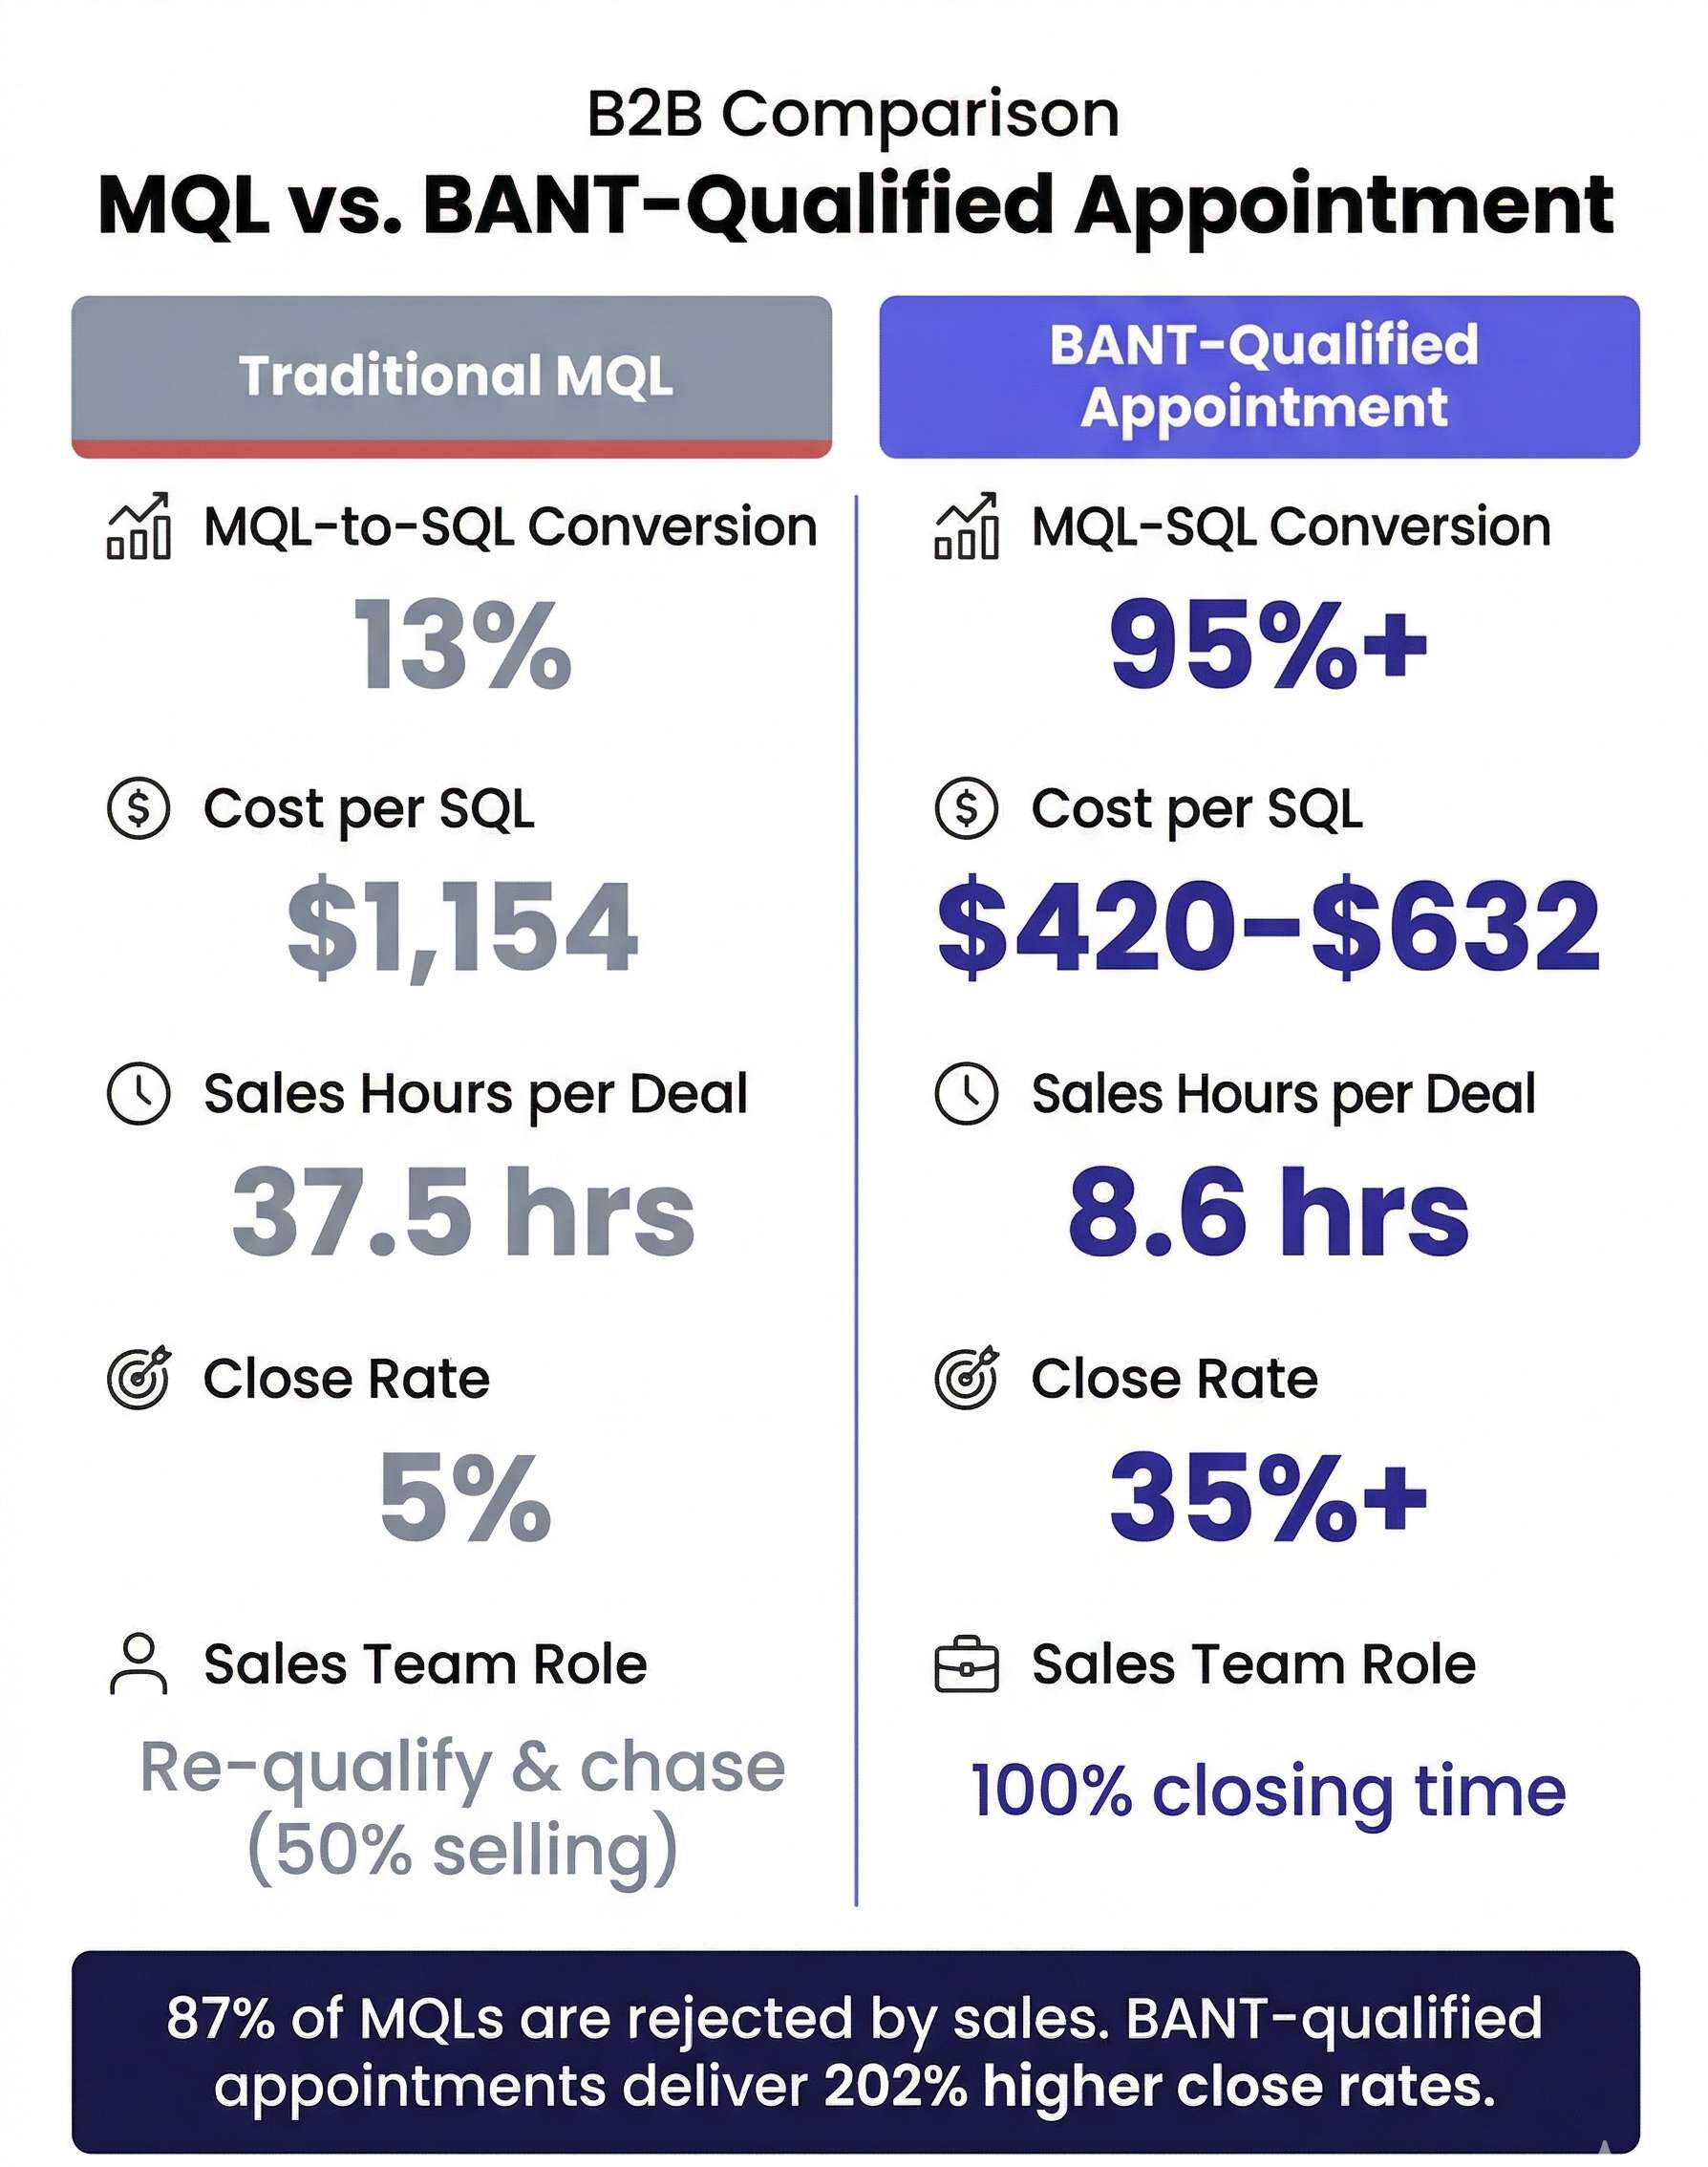
BANT — Budget, Authority, Need, Timeline — is the qualification standard that separates a conversation from a pipeline opportunity. Most ABM programs treat SQL conversion as the measure of pipeline entry. The problem: SQL definitions vary wildly between organizations, and many “SQLs” have never had their budget, authority, or timeline confirmed.
| Metric | Traditional MQL Model | BANT-Qualified Appointment Model |
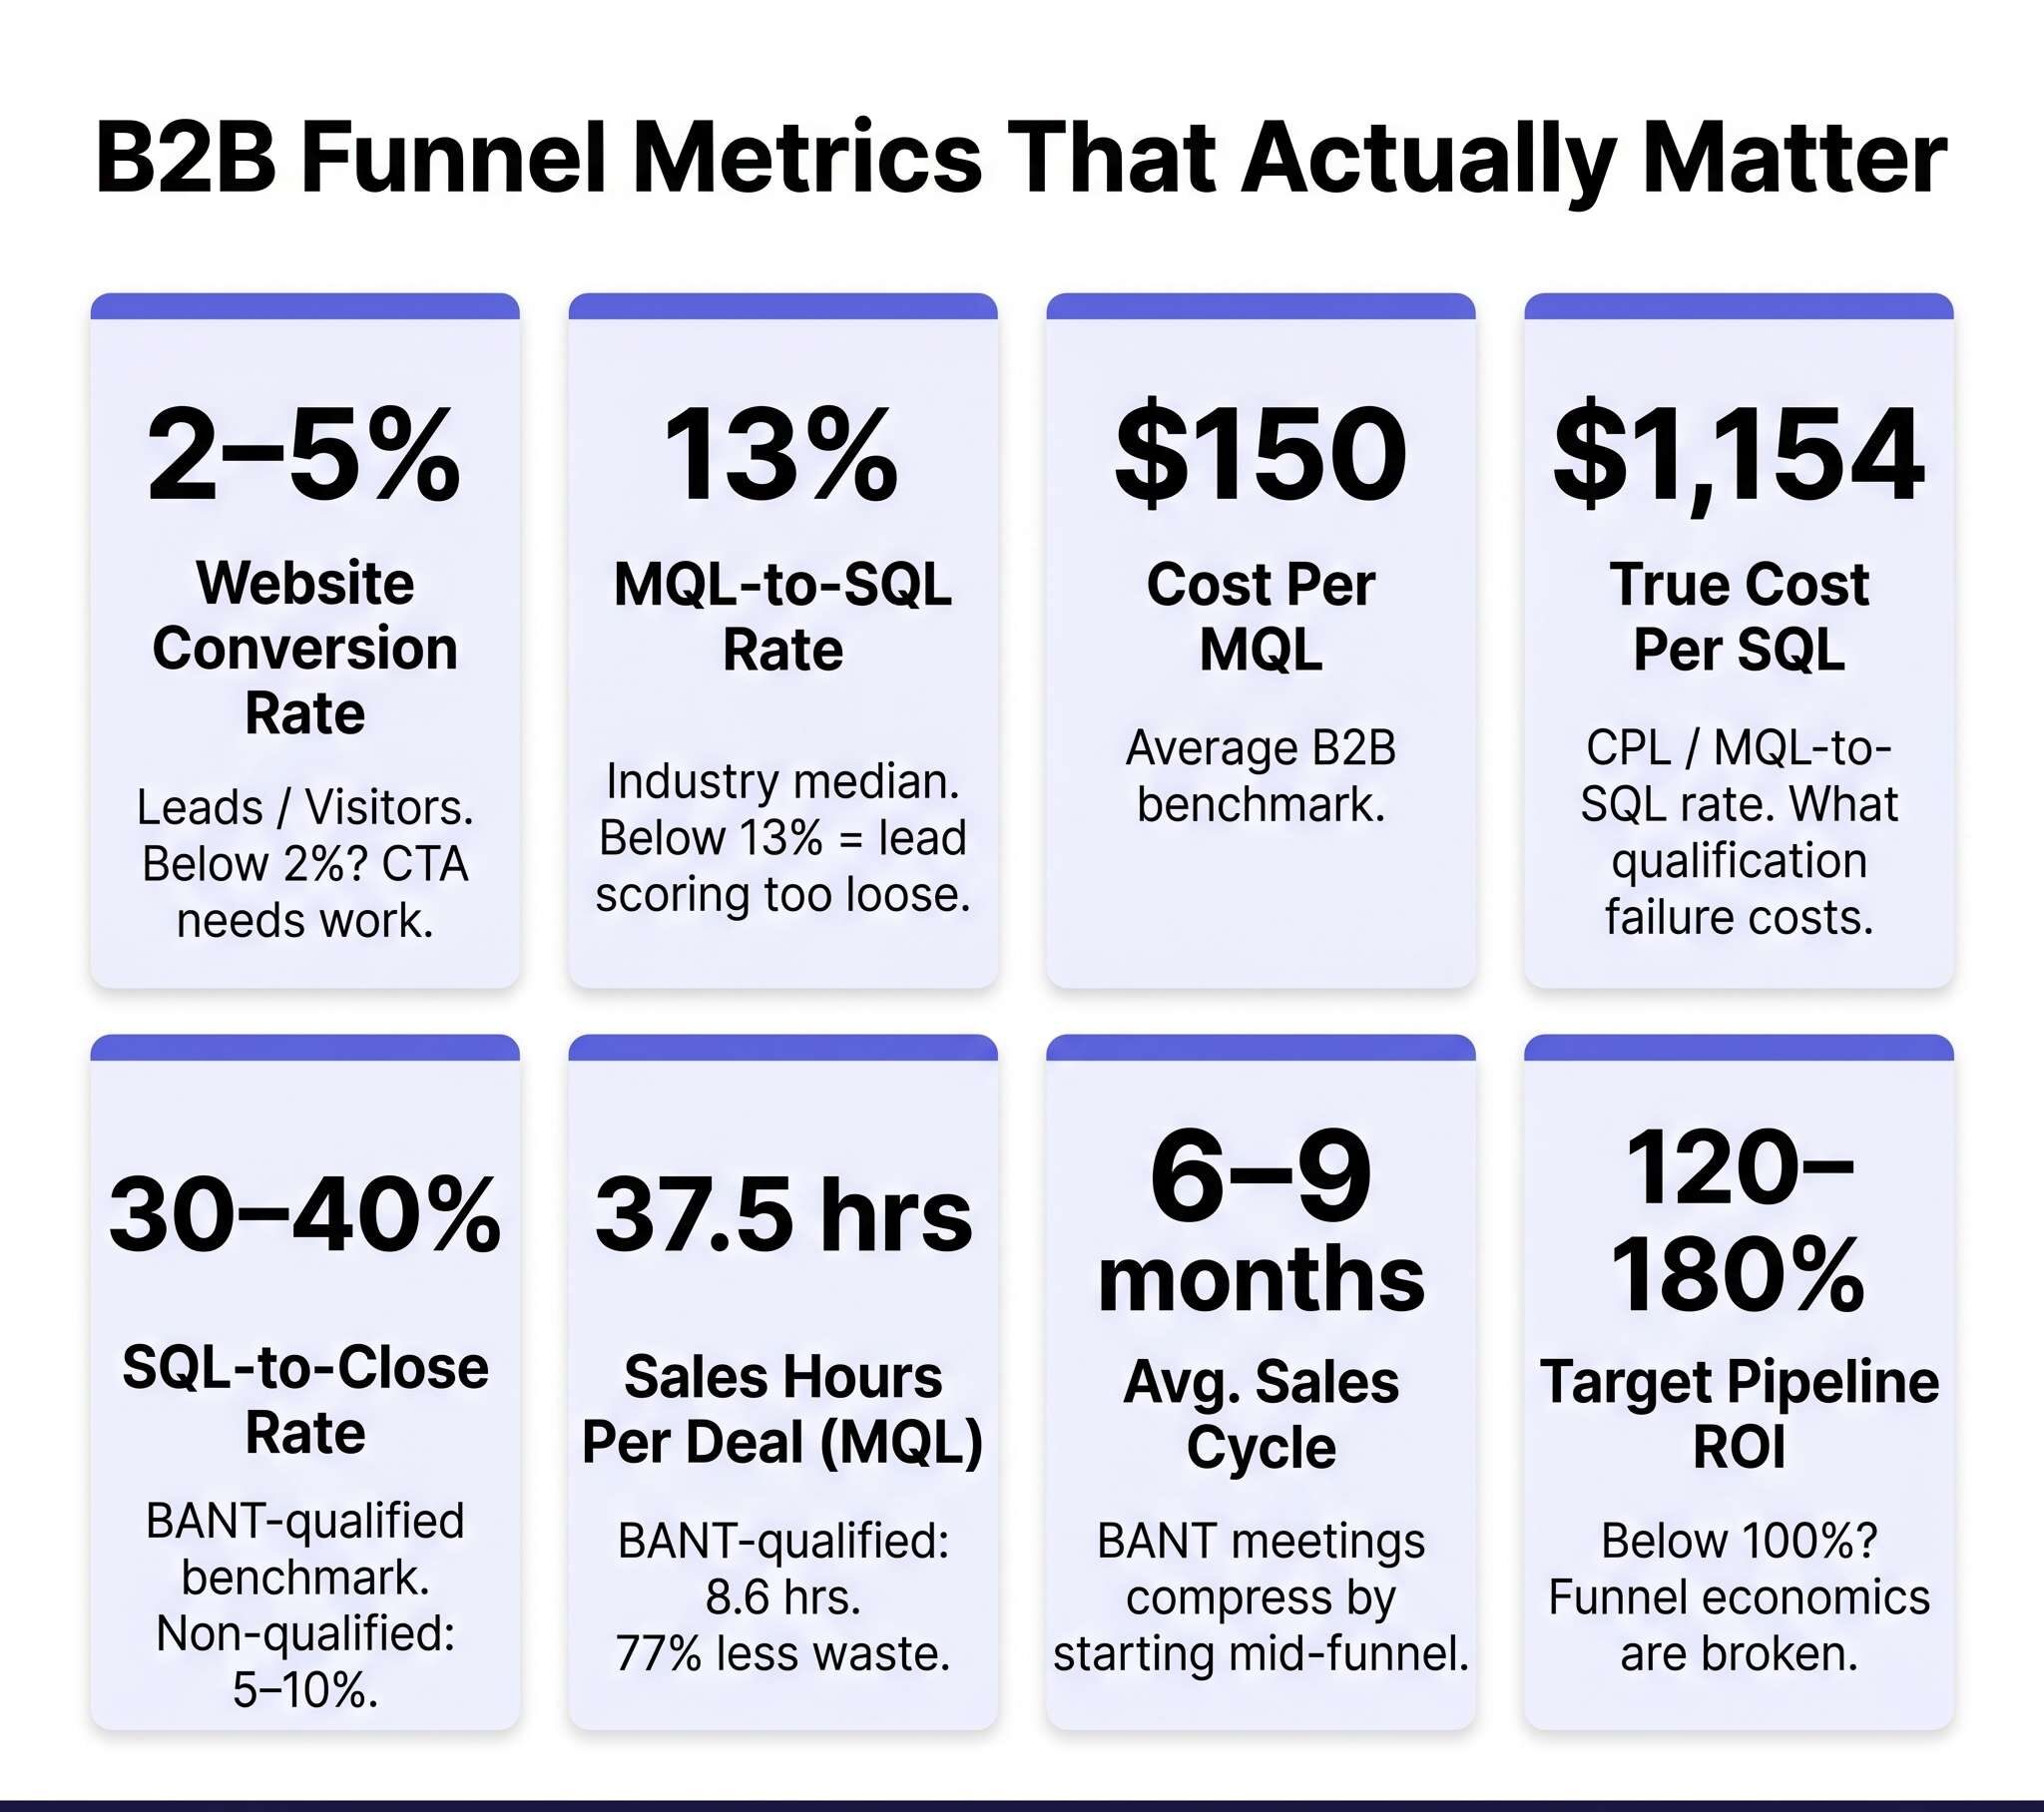
| Cost per MQL | $150 | $400–600 |
| Conversion to SQL | 13% | 95%+ |
| Cost per SQL | $1,154 | $420–632 |
| Sales hours per SQL | 8–12 hours | <1 hour |
| Pipeline predictability | Low | High |
| ★ What This Means for Your ABM Scorecard
If your ABM program isn’t measuring BANT qualification rate and cost per qualified appointment, you are measuring the wrong thing. You can be running a world-class ABM program and still generating zero net-new revenue if the meetings reaching your sales team are unqualified. |
Stage 4: Opportunity & Revenue — Bottom of Funnel
Bottom-funnel ABM metrics are the ones your CFO and CRO actually care about. These measure whether your ABM investment translates to revenue.
| KPI | What It Measures |
| ABM-Influenced Pipeline Value ($) | Total value of open opportunities from ABM-targeted accounts |
| ABM-Sourced Revenue | Closed-won revenue directly attributed to ABM programs |
| Win Rate (ABM vs Non-ABM) | Compare close rates for ABM-touched vs standard pipeline |
| Average Deal Size (ABM accounts) | ABM-targeted accounts typically yield 2–3x larger deals |
| Sales Cycle Length (ABM vs non-ABM) | Well-run ABM shortens sales cycles by 30–40% |
| Pipeline ROI | Pipeline value generated / total ABM investment |
| Revenue ROI | Closed-won revenue / total ABM investment |
Bottom-Funnel Benchmarks (2026)
- Win Rate: ABM-sourced pipeline should close at 2–3x the rate of non-ABM pipeline
- Deal Size: Enterprise ABM programs typically yield 40–70% larger average deal sizes
- Sales Cycle: 30–40% shorter for accounts with 3+ multi-touch touchpoints before first meeting
- Revenue ROI: A mature ABM program should deliver 5:1 to 10:1 pipeline ROI on investment
3. How to Build an ABM Scorecard That Sales and Marketing Both Agree On
The biggest internal failure in ABM programs is alignment collapse — marketing measures what they can control (reach, engagement, MQLs), sales measures what they care about (qualified meetings, pipeline, revenue). Neither team speaks the same language, and the program collapses into political blame-shifting.
An effective ABM scorecard bridges that gap by including metrics from every funnel stage with clear ownership.
The DemandNexus ABM Scorecard Framework
| Metric | Owner | Funnel Stage | Benchmark |
| TAL Coverage Rate | Marketing | Top of Funnel | >80% |
| Intent Signal Score (Avg.) | Marketing | Top of Funnel | Top 20% prioritized |
| Account Engagement Score | Marketing | Mid-Funnel | 3+ interactions/30 days |
| Buying Committee Coverage | Marketing | Mid-Funnel | 2+ contacts per account |
| BANT Qualification Rate | Sales + Marketing | Qualification | >60% of meetings |
| Cost Per Qualified Appointment | Sales + Marketing | Qualification | $400–600 benchmark |
| Appointment-to-Opportunity Rate | Sales | Pipeline Entry | >70% |
| ABM-Influenced Pipeline ($) | Sales | Bottom Funnel | Track monthly |
| Win Rate vs Non-ABM | Sales | Bottom Funnel | 2–3x standard pipeline |
| Revenue ROI | Leadership | Bottom Funnel | 5:1+ target |
This scorecard design forces the conversation away from ‘how many MQLs did we generate’ toward ‘how many qualified meetings are on the calendar and what is the resulting pipeline value.’ That is the conversation that aligns sales and marketing around shared revenue outcomes.
4. ABM Dashboard Best Practices: What to Track Weekly vs Monthly
Not all ABM metrics deserve the same review cadence. Tracking everything weekly creates noise. Reviewing the wrong metrics monthly means slow feedback loops when campaigns underperform.
Weekly ABM Metrics (Operational Review)
- New high-intent accounts entering the TAL (intent score threshold breached)
- Outreach sequences launched and response rates by channel
- Meetings scheduled this week vs target
- BANT disqualification reasons (track patterns — repeated budget objections signal wrong ICP)
- No-show rate and replacement meeting status
Monthly ABM Metrics (Performance Review)
- Total BANT-qualified appointments delivered vs monthly SLA
- Cost per qualified appointment (vs prior month and benchmark)
- Appointment-to-opportunity conversion rate
- Pipeline generated from ABM-sourced meetings
- Accounts progressing through funnel stages (cohort view)
- Win rate and average deal size vs non-ABM pipeline
Quarterly ABM Metrics (Strategic Review)
- Revenue ROI on full ABM investment
- TAL account coverage and ICP refresh
- Media brand intent data performance by vertical
- Sales cycle comparison: ABM vs standard pipeline
- Data asset growth (total BANT-qualified prospects owned)
| The ABM Dashboard Rule of Three
Every effective ABM dashboard should answer three questions at a glance: 1. Are the right accounts showing buying intent? (Top-of-funnel health) 2. Are engaged accounts converting to qualified meetings? (Mid-funnel efficiency) 3. Are qualified meetings converting to closed revenue? (Bottom-funnel ROI) If your current dashboard can’t answer all three, rebuild it. |
5. The ABM Metric Most Teams Miss: Pre-Meeting Intelligence Quality
There is one ABM metric almost no team tracks — but it may be the single highest-leverage indicator of whether your appointments will close.
We call it: Appointment Handover Quality.
A qualified meeting is not just a time slot on a calendar. It is a structured briefing document that prepares your Account Executive to walk in and close — not discover. The quality of that pre-meeting intelligence determines whether your AE spends the first 20 minutes learning who they’re talking to, or whether they spend those 20 minutes building on a fully-verified picture of the opportunity.
What the Appointment Handover Sheet (AHO) Captures
| AHO Component | What It Contains |
| BANT Verification | Budget confirmed, authority verified, need documented, timeline locked |
| Executive Summary | Who the prospect is, what they manage, what problem they’re solving |
| Conversation Intelligence | Exact words used, hot buttons identified, objections to expect |
| Competitive Intelligence | Vendors being evaluated, current solution, gaps driving the search |
| Meeting Objective | Specific outcome to achieve, features to demo, questions to ask |
| Close Criteria | The precise next step that moves the deal forward from this meeting |
At DemandNexus, every BANT-qualified appointment includes a complete AHO. The result: 90% of appointments convert to qualified pipeline — compared to 50–70% for in-house SDR teams — because the AE walks in with complete buying committee intelligence, verified budget, and a clear path to the next step.
| AHO Metric to Track: Pre-Meeting Intelligence Score
Score every appointment on a 1-5 scale across six dimensions: Budget confirmation | Authority verification | Need documentation Timeline confirmation | Competitive intelligence | Recommended close criteria Target: Average score of 4.5+ across all delivered appointments. If your average is below 3.0, your appointments are conversations, not pipeline. |
6. ABM Success Metrics by Program Type
Not all ABM programs are built the same. The right KPIs depend on whether you’re running a 1:1, 1:Few, or 1:Many program — and whether you’re in a land-and-expand motion, a new market entry, or a competitive displacement scenario.
1:1 ABM (Strategic Account Programs)
- Target: 5–50 named accounts with fully customized programs
- Primary KPIs: Account engagement depth, buying committee coverage, deal progression
- Benchmark: 6–12 month sales cycles; track monthly buying committee expansion
- Success Metric: % of target accounts with an active pipeline opportunity
1:Few ABM (Cluster Programs)
- Target: 50–500 accounts segmented by vertical, persona, or pain point
- Primary KPIs: Account Engagement Score, BANT qualification rate, cost per appointment
- Benchmark: 30–90 day outreach cycles; 60–70% BANT qualification rate of engaged accounts
- Success Metric: Monthly qualified appointments per account cluster
1:Many ABM (Programmatic)
- Target: 500–5,000 ICP accounts with automated, intent-triggered outreach
- Primary KPIs: Intent signal coverage, response rate, meeting request rate
- Benchmark: 3–5% meeting request rate from intent-triggered outreach
- Success Metric: Cost per appointment vs pipeline-to-spend ratio
7. How to Measure ABM Effectiveness: The Zero-Waste Pipeline Model
The ultimate measure of ABM effectiveness is not how many accounts you touched. It is how much of your ABM investment converts to revenue with zero waste.
Waste in ABM pipelines has three sources:
| Waste Type | Definition |
| Top-of-funnel waste | Reaching accounts outside your ICP, generating impressions with no buying intent |
| Mid-funnel waste | Generating engagement from non-decision-makers or low-priority contacts |
| Bottom-funnel waste | Scheduling meetings with prospects who haven’t been BANT-qualified — unverified budget, authority, or timeline |
The Zero-Waste Pipeline Model eliminates waste at every stage through a disciplined qualification waterfall:
- Stage 1 — Intent Filtering: Only accounts showing active, named, 1st-party intent signals enter outreach
- Stage 2 — BANT Pre-Screening: SDRs conduct live discovery calls before any meeting is scheduled
- Stage 3 — Decision-Maker Verification: Authority is confirmed — not assumed — before calendar lock
- Stage 4 — AHO Delivery: Every appointment comes with a complete pre-meeting intelligence brief
- Stage 5 — Performance Accountability: SLA-backed delivery means you only pay for qualified meetings that show up
The result: DemandNexus clients achieve a <5% post-meeting disqualification rate — compared to 25–30% for in-house SDR teams under quota pressure. Every meeting that reaches your AE has been through a rigorous filter. The pipeline is real.
8. ABM Benchmarks: What Good Looks Like in 2026
One of the most common questions in ABM measurement is: “Is our performance normal, or do we have a problem?” Here is a practical benchmark reference for B2B ABM programs in 2026.
| Metric | Industry Average | Best-in-Class |
| Account Engagement Score (Avg.) | 3–5 interactions/account/month | 8–12 interactions/account/month |
| BANT Qualification Rate | 30–40% of engaged accounts | 60–75% of engaged accounts |
| Appointment Set Rate (from outreach) | 3–8% | 15–25% (context-aware outbound) |
| Cost Per Qualified Appointment | $800–$1,200 | $400–$600 |
| Appointment-to-Opportunity Rate | 50–70% | 90–95% |
| Win Rate (ABM vs non-ABM) | 1.5x | 2.5–3x |
| Sales Cycle Length (ABM) | Baseline | 30–40% shorter |
| Pipeline ROI | 3:1 | 8:1 to 12:1 |
| Post-Meeting Disqualification Rate | 25–30% | <5% |
9. Common ABM Measurement Mistakes (And How to Fix Them)
Mistake 1: Using MQL Volume as a Success Metric
The fix: Replace “MQLs generated” with “BANT-qualified appointments scheduled.” An MQL tells you someone engaged. A BANT-qualified appointment tells you someone is ready to buy.
Mistake 2: Measuring Account Reach Without Buying Committee Coverage
The fix: Track the number of confirmed buying committee members engaged per account. Enterprise deals require consensus — reaching one person is not the same as penetrating the account.
Mistake 3: Reporting on Activity, Not Funnel Progression
The fix: Build your ABM scorecard around stage-to-stage conversion rates, not absolute activity numbers. “We sent 10,000 emails” is not a metric. “32% of intent-triggered accounts converted to a discovery meeting” is a metric.
Mistake 4: Ignoring Pre-Meeting Intelligence Quality
The fix: Score every appointment on BANT completeness and intelligence depth before it is passed to the AE. If the meeting hasn’t been fully pre-qualified, it should not be on the calendar.
Mistake 5: Measuring ABM ROI Too Early
The fix: ABM requires 90+ days to generate reliable pipeline data. Set a 12-month performance horizon for revenue ROI measurement, with monthly checkpoints on qualified appointment volume and pipeline entry rate.
Stop Measuring Activity. Start Measuring Pipeline.
DemandNexus delivers BANT-qualified appointments — not MQLs, not leads, not impressions. Every meeting arrives with a complete Appointment Handover Sheet, pre-verified buying committee data, and a confirmed timeline. Your sales team walks in prepared to close.
| The DemandNexus Waterfall Guarantee
15+ BANT-qualified appointments per month, SLA-backed. Pay only for meetings that show up and meet your criteria. Zero-risk billing. Full data ownership. Permanent client asset. Month 1: 15+ BANT-verified appointments — or you pay nothing for the shortfall. Months 2–12: Same guarantee. Every month. sales@demandnexus.io | demandnexus.io |
Packages start at $7,500/month (Essentials: 15+ meetings/month) with Growth and Enterprise tiers available for teams requiring 25+ and 40+ qualified appointments per month. All packages include an 8-person dedicated pod, real-time dashboard, weekly business reviews, and permanent data ownership.
FAQs
What is the most important ABM metric to track?
Revenue won from target accounts is the ultimate ABM metric because it directly measures program impact on business outcomes. However, this lagging indicator should be paired with leading indicators like qualified meetings booked and pipeline influence to enable proactive optimization.
How do ABM metrics differ from traditional marketing KPIs?
ABM metrics focus on account-level engagement and progression rather than individual lead volume. Traditional marketing measures how many leads enter the funnel; ABM measures how effectively specific target accounts move toward purchase decisions.
What is a good engagement rate for ABM target accounts?
Benchmark engagement rates vary by industry and ABM maturity, but leading programs typically engage 40-60% of target accounts meaningfully within the first 90 days. More important than raw engagement percentage is engagement quality—whether engaged accounts demonstrate genuine buying intent.
How do I calculate ABM ROI?
Calculate ABM ROI by dividing revenue generated from ABM accounts by total ABM program investment (including technology, content, advertising, and personnel costs). Leading ABM programs report ROI ranging from 100% to 400% annually, though results vary significantly based on program maturity and execution.
What is BANT qualification and why does it matter for ABM?
BANT stands for Budget, Authority, Need, and Timeline—the four criteria that determine whether a prospect is genuinely sales-ready. Integrating BANT verification into ABM measurement ensures that engagement metrics correlate with actual buying readiness rather than casual content consumption.
How often should I review ABM metrics?
Review engagement and activity metrics weekly to catch issues early. Assess conversion rates and pipeline progression monthly. Evaluate revenue impact and program ROI quarterly. This cadenced approach balances responsiveness with strategic perspective.
What tools do I need to track ABM metrics?
Essential ABM measurement infrastructure includes a CRM system for pipeline tracking, marketing automation platform for engagement monitoring, account-based advertising platform with reporting capabilities, and analytics tools that can aggregate data across contact touchpoints to the account level.