Vanity metrics are comfortable. They show activity. But activity is not pipeline, and pipeline is not revenue. The sales lead generation KPIs that actually matter are the ones that predict revenue outcomes — not the ones that make weekly reports look busy.
Here are the 12 metrics revenue leaders should track, why each one matters, and the benchmarks to aim for.
Why Most Lead Generation KPI Frameworks Are Wrong
The traditional lead generation dashboard optimises for top-of-funnel volume: total leads, CPL, MQL count. These metrics reward activity and punish nothing — which is precisely the problem. A team generating 500 MQLs per month that convert at 2% is performing worse than a team generating 50 BANT-qualified appointments that convert at 35%.
The shift from volume metrics to quality metrics is the single most impactful upgrade a revenue operations team can make to its measurement framework.
What KPIs should I track for B2B sales lead generation?
Track conversion rates at each funnel stage, cost per qualified appointment (not cost per lead), pipeline coverage ratio, and ultimately cost per closed deal. These metrics connect lead generation activity to revenue outcomes and expose where qualification is failing.
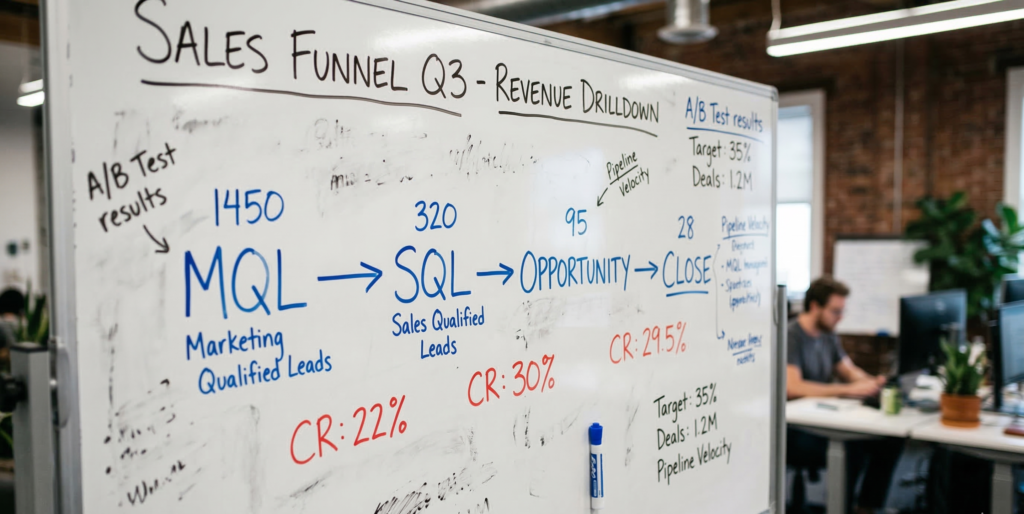
The 12 Sales Lead Generation KPIs That Matter
1. MQL-to-SQL Conversion Rate
What it measures: The percentage of marketing-qualified leads that pass sales qualification and become sales-qualified leads.
Why it matters: A low MQL-to-SQL rate is the clearest signal that marketing is generating unqualified volume. It means SDRs are spending most of their time rejecting leads that never should have entered the pipeline.
Benchmark: 20–30%. Below 15% indicates a significant ICP or qualification disconnect.
2. SQL-to-Opportunity Conversion Rate
What it measures: The percentage of sales-qualified leads that advance to active pipeline opportunities.
Why it matters: This is the bridge between qualification and real selling. A high SQL-to-opportunity rate means your qualification process is genuinely identifying sales-ready prospects.
Benchmark: 50–70%.
3. Opportunity-to-Close Rate
What it measures: The percentage of pipeline opportunities that close as won deals.
Why it matters: This is the ultimate signal of lead quality. If close rates are low, the problem often traces back to poor qualification upstream — leads entered the pipeline before they were genuinely ready.
Benchmark: 20–35% for BANT-qualified opportunities. BANT-verified prospects close at 2–3x the rate of unverified MQLs.
4. Cost Per Lead (CPL)
What it measures: Total spend divided by total leads generated.
Why it matters (and why it’s often misleading): CPL is necessary for channel efficiency comparisons — but dangerous as a primary optimisation metric. Chasing lower CPL often means accepting lower quality, which drives up cost per closed deal.
Benchmark: $50–$400+ depending on channel and industry. Context required.
5. Cost Per Qualified Appointment
What it measures: Total spend divided by BANT-verified, calendar-booked meetings.
Why it matters: This is a more meaningful metric than CPL because it measures the cost of a sales-ready conversation — not just a contact record. A $500 qualified appointment that closes at 35% is dramatically cheaper than a $50 lead that converts at 2%.
Benchmark: $300–$600 for B2B SaaS and tech.
6. Cost Per Closed Deal
What it measures: Total lead generation spend divided by won deals.
Why it matters: This is the only metric that connects lead generation investment directly to revenue. It eliminates the distortion of intermediate conversion metrics and reveals the true ROI of each channel and model.
How to calculate: Total lead gen spend ÷ number of closed deals = cost per closed deal.
7. Sales Cycle Length
What it measures: Average days from first sales conversation to closed deal.
Why it matters: BANT-qualified leads have shorter sales cycles because qualification surfaces objections and confirms readiness before the AE is involved. Unqualified leads extend sales cycles as objections emerge late in the process.
Benchmark: Varies enormously by deal size. BANT-qualified opportunities typically close 20–40% faster than unverified leads.
8. Lead Response Time
What it measures: Time from lead generation to first sales contact.
Why it matters: Studies consistently show that leads contacted within 5 minutes convert at dramatically higher rates than those contacted after 30 minutes. For inbound leads especially, speed is a conversion lever.
Benchmark: Under 5 minutes for inbound; same-day for outbound follow-up.
9. Pipeline Coverage Ratio
What it measures: Total pipeline value divided by quota.
Why it matters: Revenue leaders need to maintain sufficient pipeline coverage to absorb expected deal slippage and still hit quota. Coverage below 3x is a warning signal.
Benchmark: 3–4x quota minimum. 4–5x for B2B companies with longer sales cycles.
10. Lead-to-Meeting Rate
What it measures: Percentage of outbound contacts or inbound leads that result in a booked sales meeting.
Why it matters: This metric exposes the efficiency of your SDR outreach and the quality of your prospect targeting. A low lead-to-meeting rate suggests poor ICP targeting, weak messaging, or both.
Benchmark: 5–15% for outbound sequences; 15–30% for intent-targeted outreach.
11. Meeting-to-Opportunity Rate
What it measures: Percentage of booked meetings that convert to active pipeline opportunities.
Why it matters: If meetings are booked but not advancing to opportunity, the qualification before booking is failing. BANT-verified meetings should convert to opportunity at 70–85%.
Benchmark: 70–85% for BANT-qualified appointments. Below 50% suggests qualification gaps.
12. No-Show Rate
What it measures: Percentage of booked meetings where the prospect does not attend.
Why it matters: No-shows represent wasted AE time and inflated meeting counts. High no-show rates suggest the meeting was booked without genuine prospect commitment — a sign of weak qualification.
Benchmark: Below 10% for well-qualified appointments. Above 20% signals a qualification problem.
Building a Lead Generation KPI Dashboard
A practical revenue operations dashboard tracks these metrics across three layers:
Funnel volume metrics: Leads generated, MQLs, SQLs, opportunities, closed deals by channel and period.
Conversion quality metrics: MQL-to-SQL rate, SQL-to-opportunity rate, opportunity-to-close rate by lead source.
Economics metrics: CPL, cost per appointment, cost per closed deal, pipeline coverage ratio.
The combination allows revenue leaders to identify exactly where the funnel is leaking — whether the problem is lead quality upstream, qualification methodology midstream, or AE execution downstream.
For a broader view of sales performance measurement, see our B2B sales KPIs guide and B2B sales funnel framework.
How DemandNexus Clients Track Lead Generation Performance
DemandNexus clients receive real-time dashboards tracking pipeline progression, meeting quality, and BANT verification status across every active appointment. Weekly Business Reviews surface conversion trends and optimise qualification criteria against actual close rates.
Because DemandNexus operates on a pay-for-performance model — billing only for meetings that happen and meet qualification criteria — the metrics are inherently honest. There is no incentive to inflate MQL counts or report activity as pipeline. The KPIs that matter are the ones that connect directly to revenue.
FAQs
What is the most important KPI for B2B sales lead generation?
Cost per closed deal is the ultimate north star — it connects every lead generation investment directly to revenue. Supporting KPIs that predict this outcome include MQL-to-SQL conversion rate, meeting-to-opportunity rate, and pipeline coverage ratio.
How do you calculate ROI from lead generation?
ROI = (Revenue from closed deals from lead gen channel – lead gen channel cost) / lead gen channel cost × 100. At DemandNexus Essentials Pod pricing ($7,500/month), with 15 appointments, 35% close rate, and $50K average deal: $5.25M revenue generated vs. $90K annual investment = 5,733% ROI.
What is a good CPL for B2B companies?
CPL is context-dependent — a $400 CPL might be excellent for a $100K ACV deal and terrible for a $5K ACV deal. Always evaluate CPL relative to average deal size and downstream conversion rates, not as an absolute target.
Author