

The Metrics That Actually Matter in 2026
Most demand gen dashboards track 30 to 50 metrics. That is 25 to 45 too many. If you can answer these five questions, you can run a world-class demand gen program:

Most B2B teams lose 40–60% of qualified prospects to broken handoffs and weak qualification. Take our 2-minute diagnostic to find out where your pipeline is bleeding — and how to fix it.
Start the Quiz → Takes 2 minutes. No email required to start.- What is our cost per BANT-qualified appointment?
- What percentage of appointments become opportunities?
- What percentage of opportunities become closed-won?
- How long is our pipeline velocity?
- What percentage of revenue is sourced by demand gen?
Everything else is either diagnostic (useful for troubleshooting) or vanity (useful for nothing).
Top-of-Funnel Metrics
Marketing Qualified Leads (MQLs)
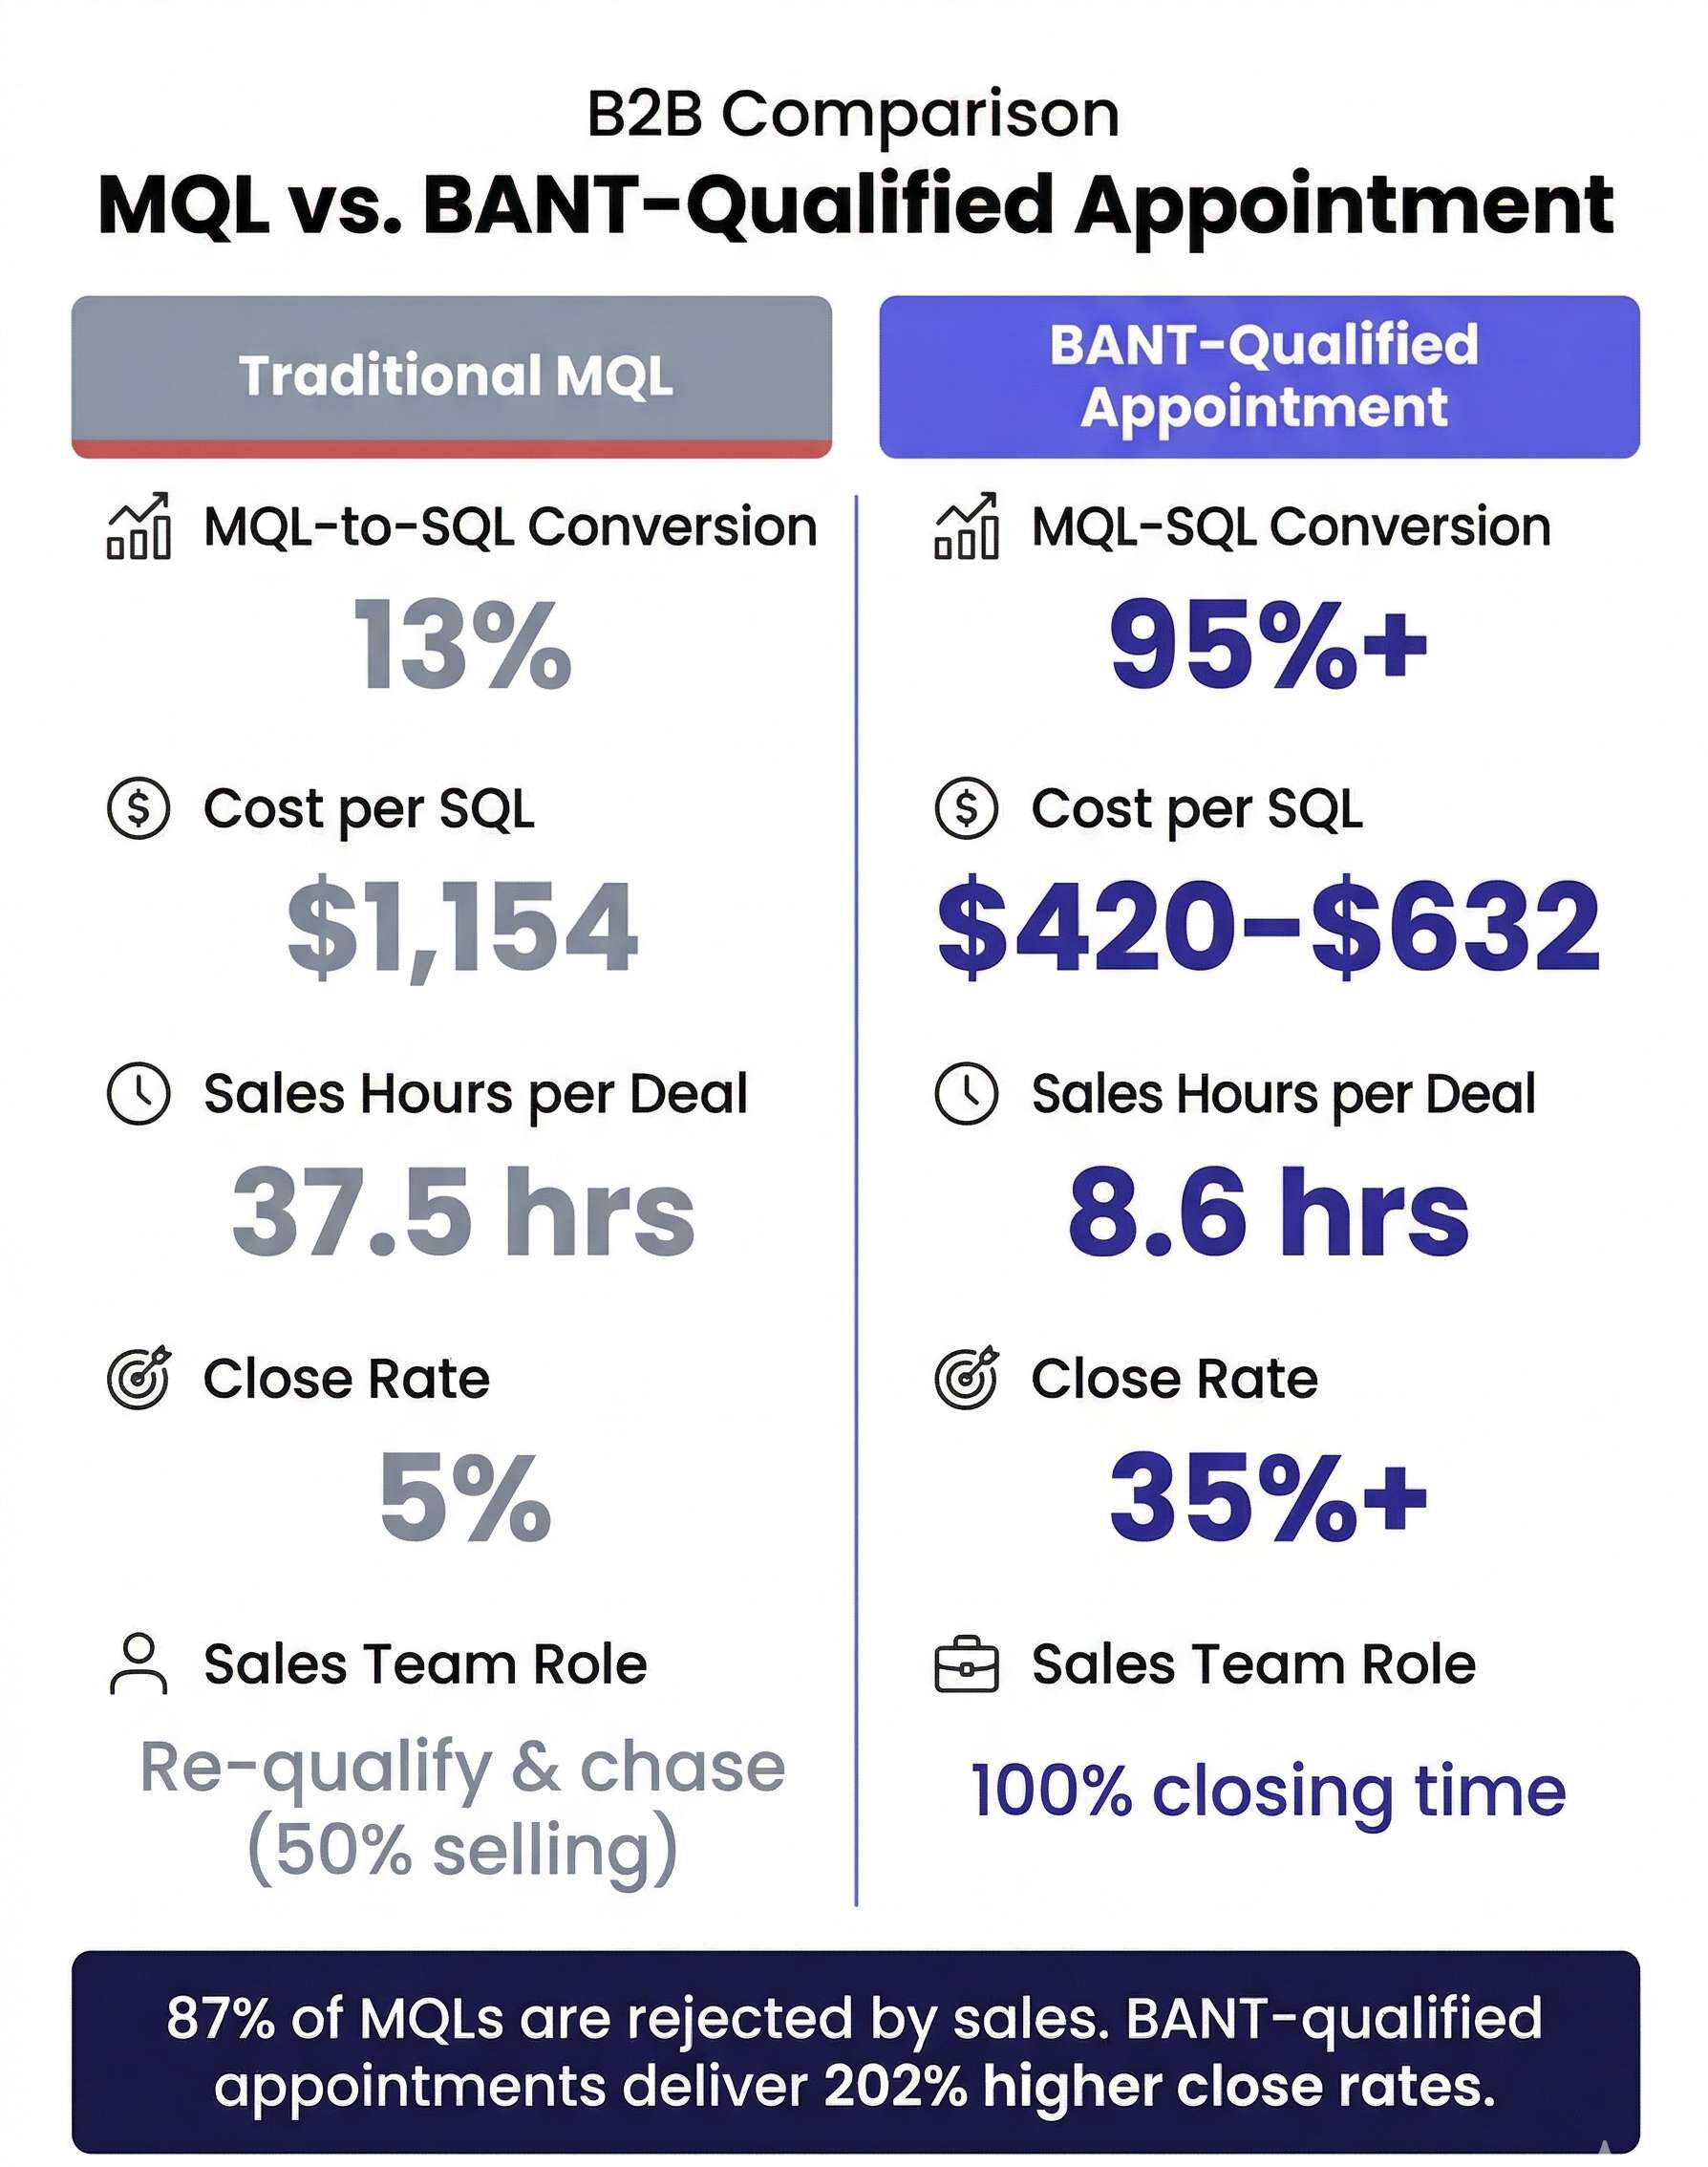
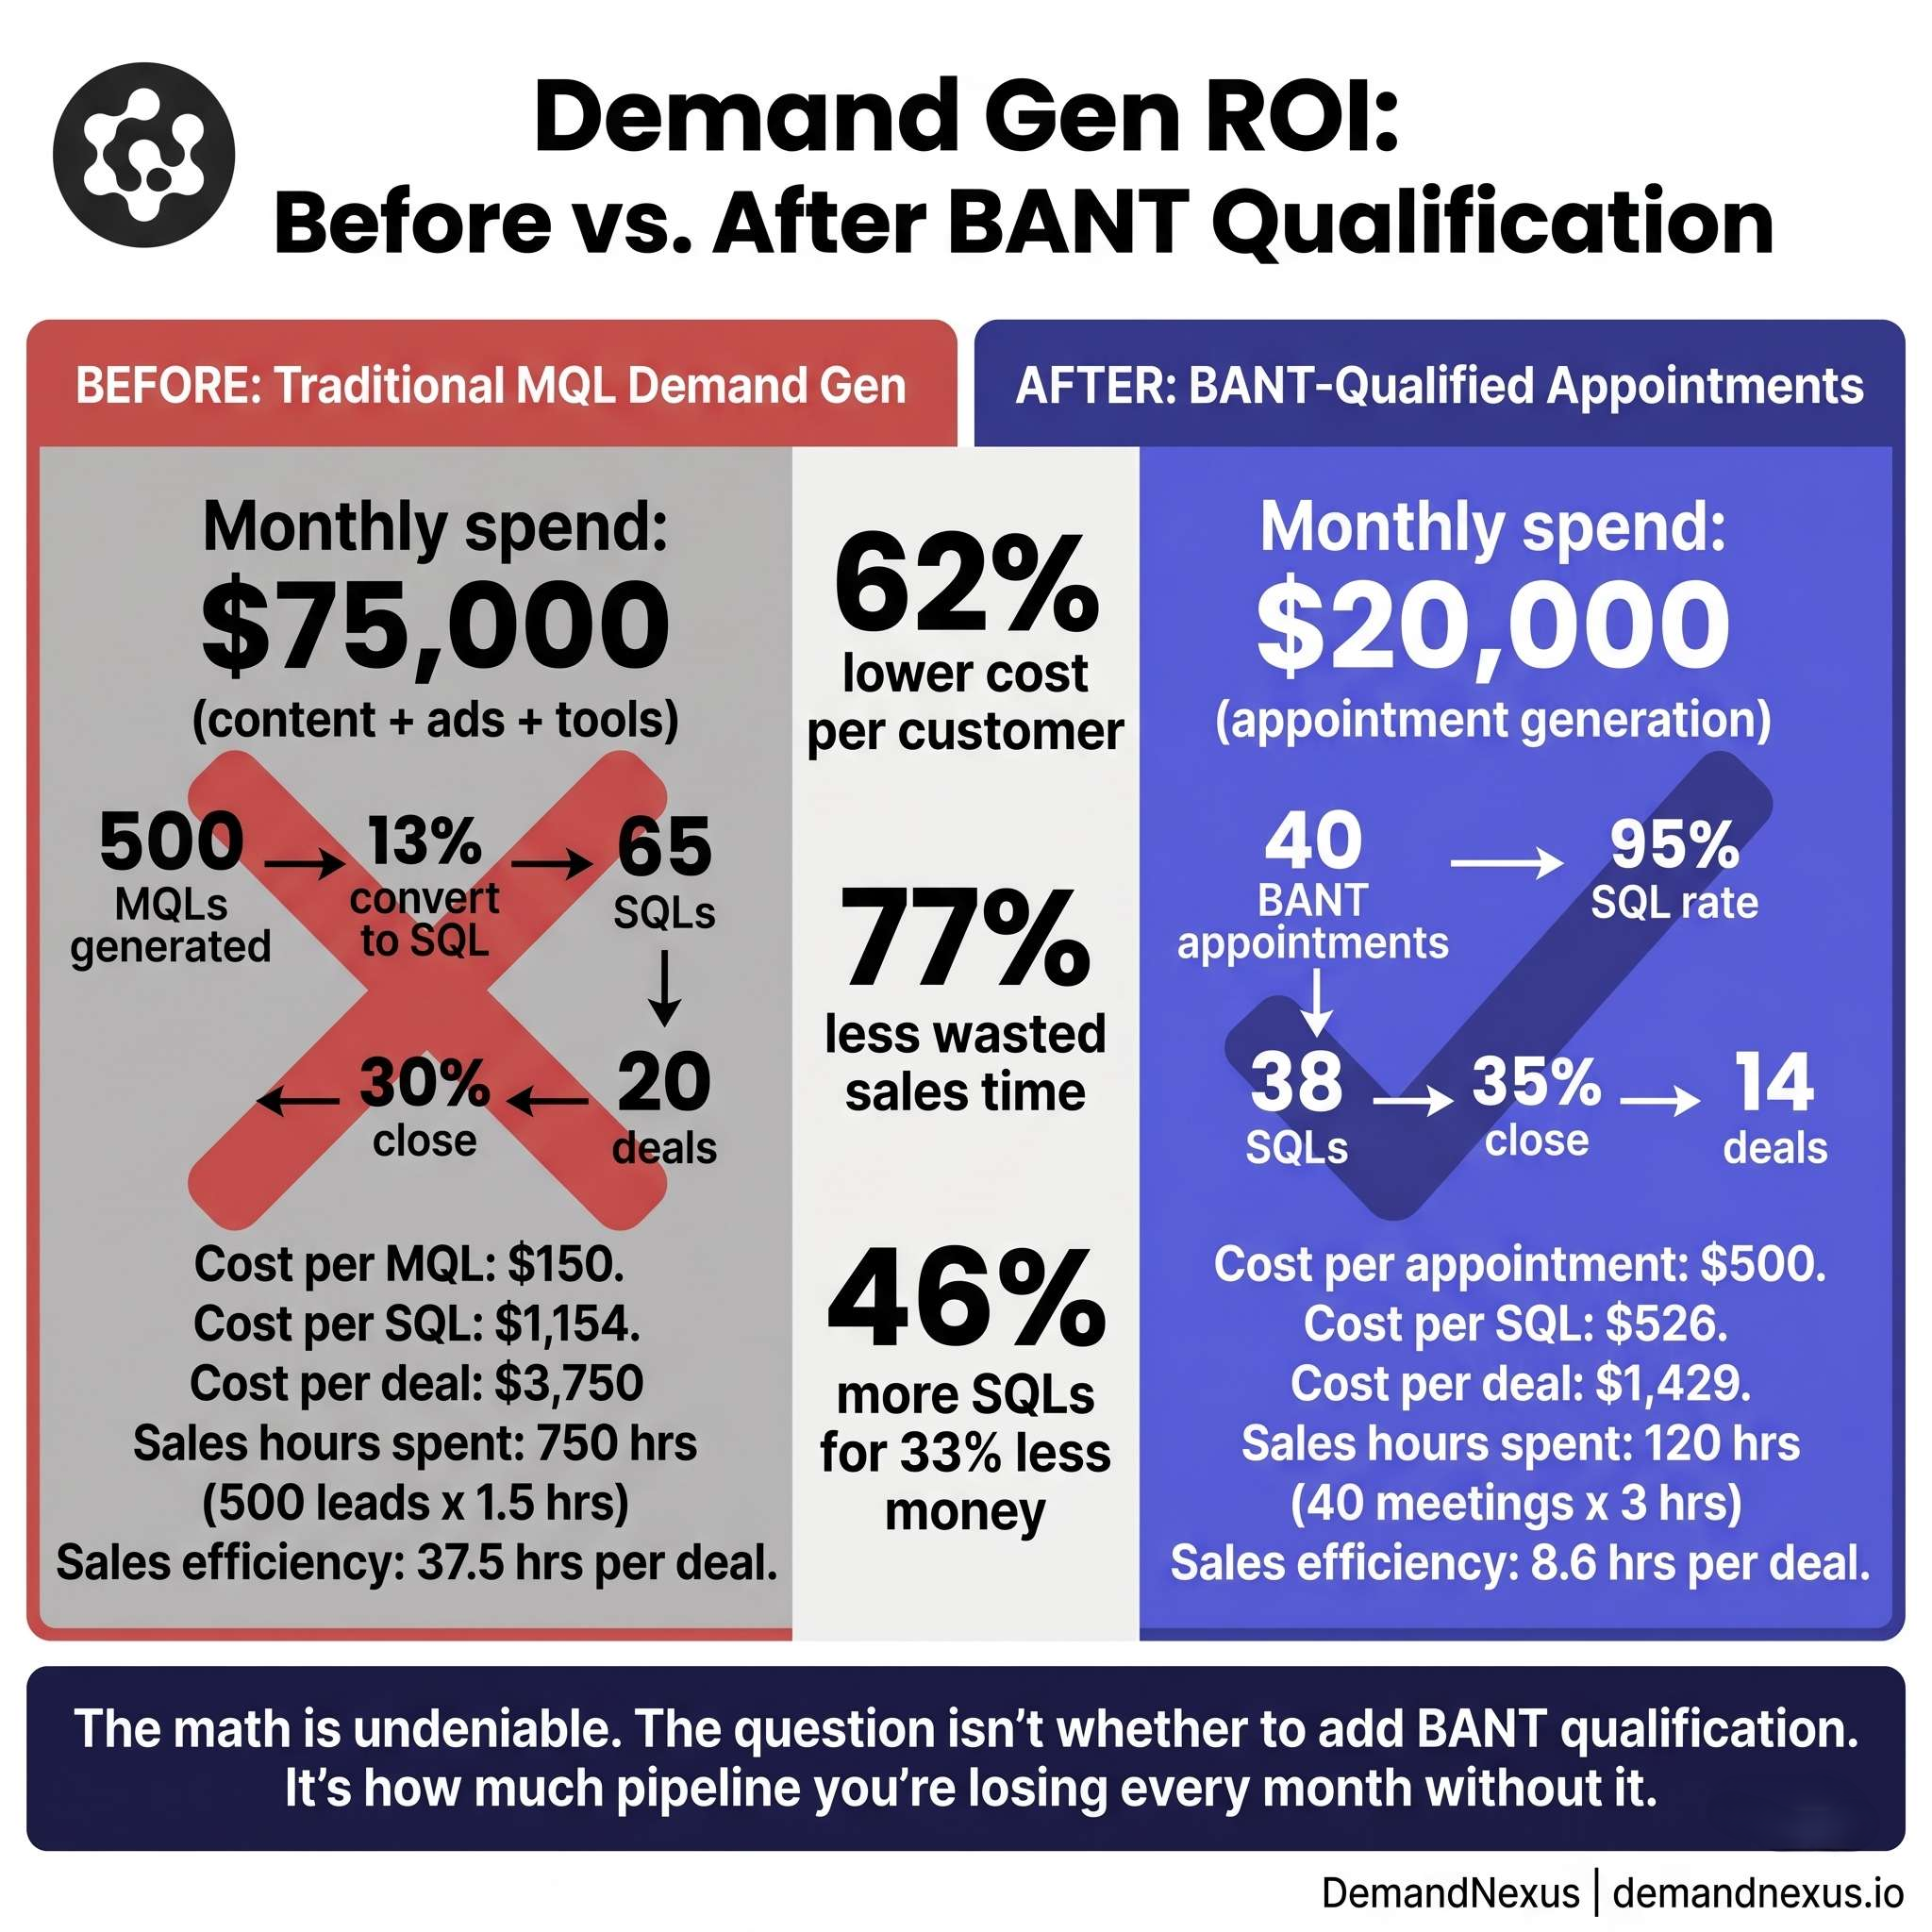
The most over-measured metric in B2B marketing. Industry average shows 87 percent of MQLs get rejected by sales. If you are measuring MQL volume without measuring MQL-to-SQL conversion, you are measuring a number that correlates with nothing that matters.

Cost Per Lead (CPL)
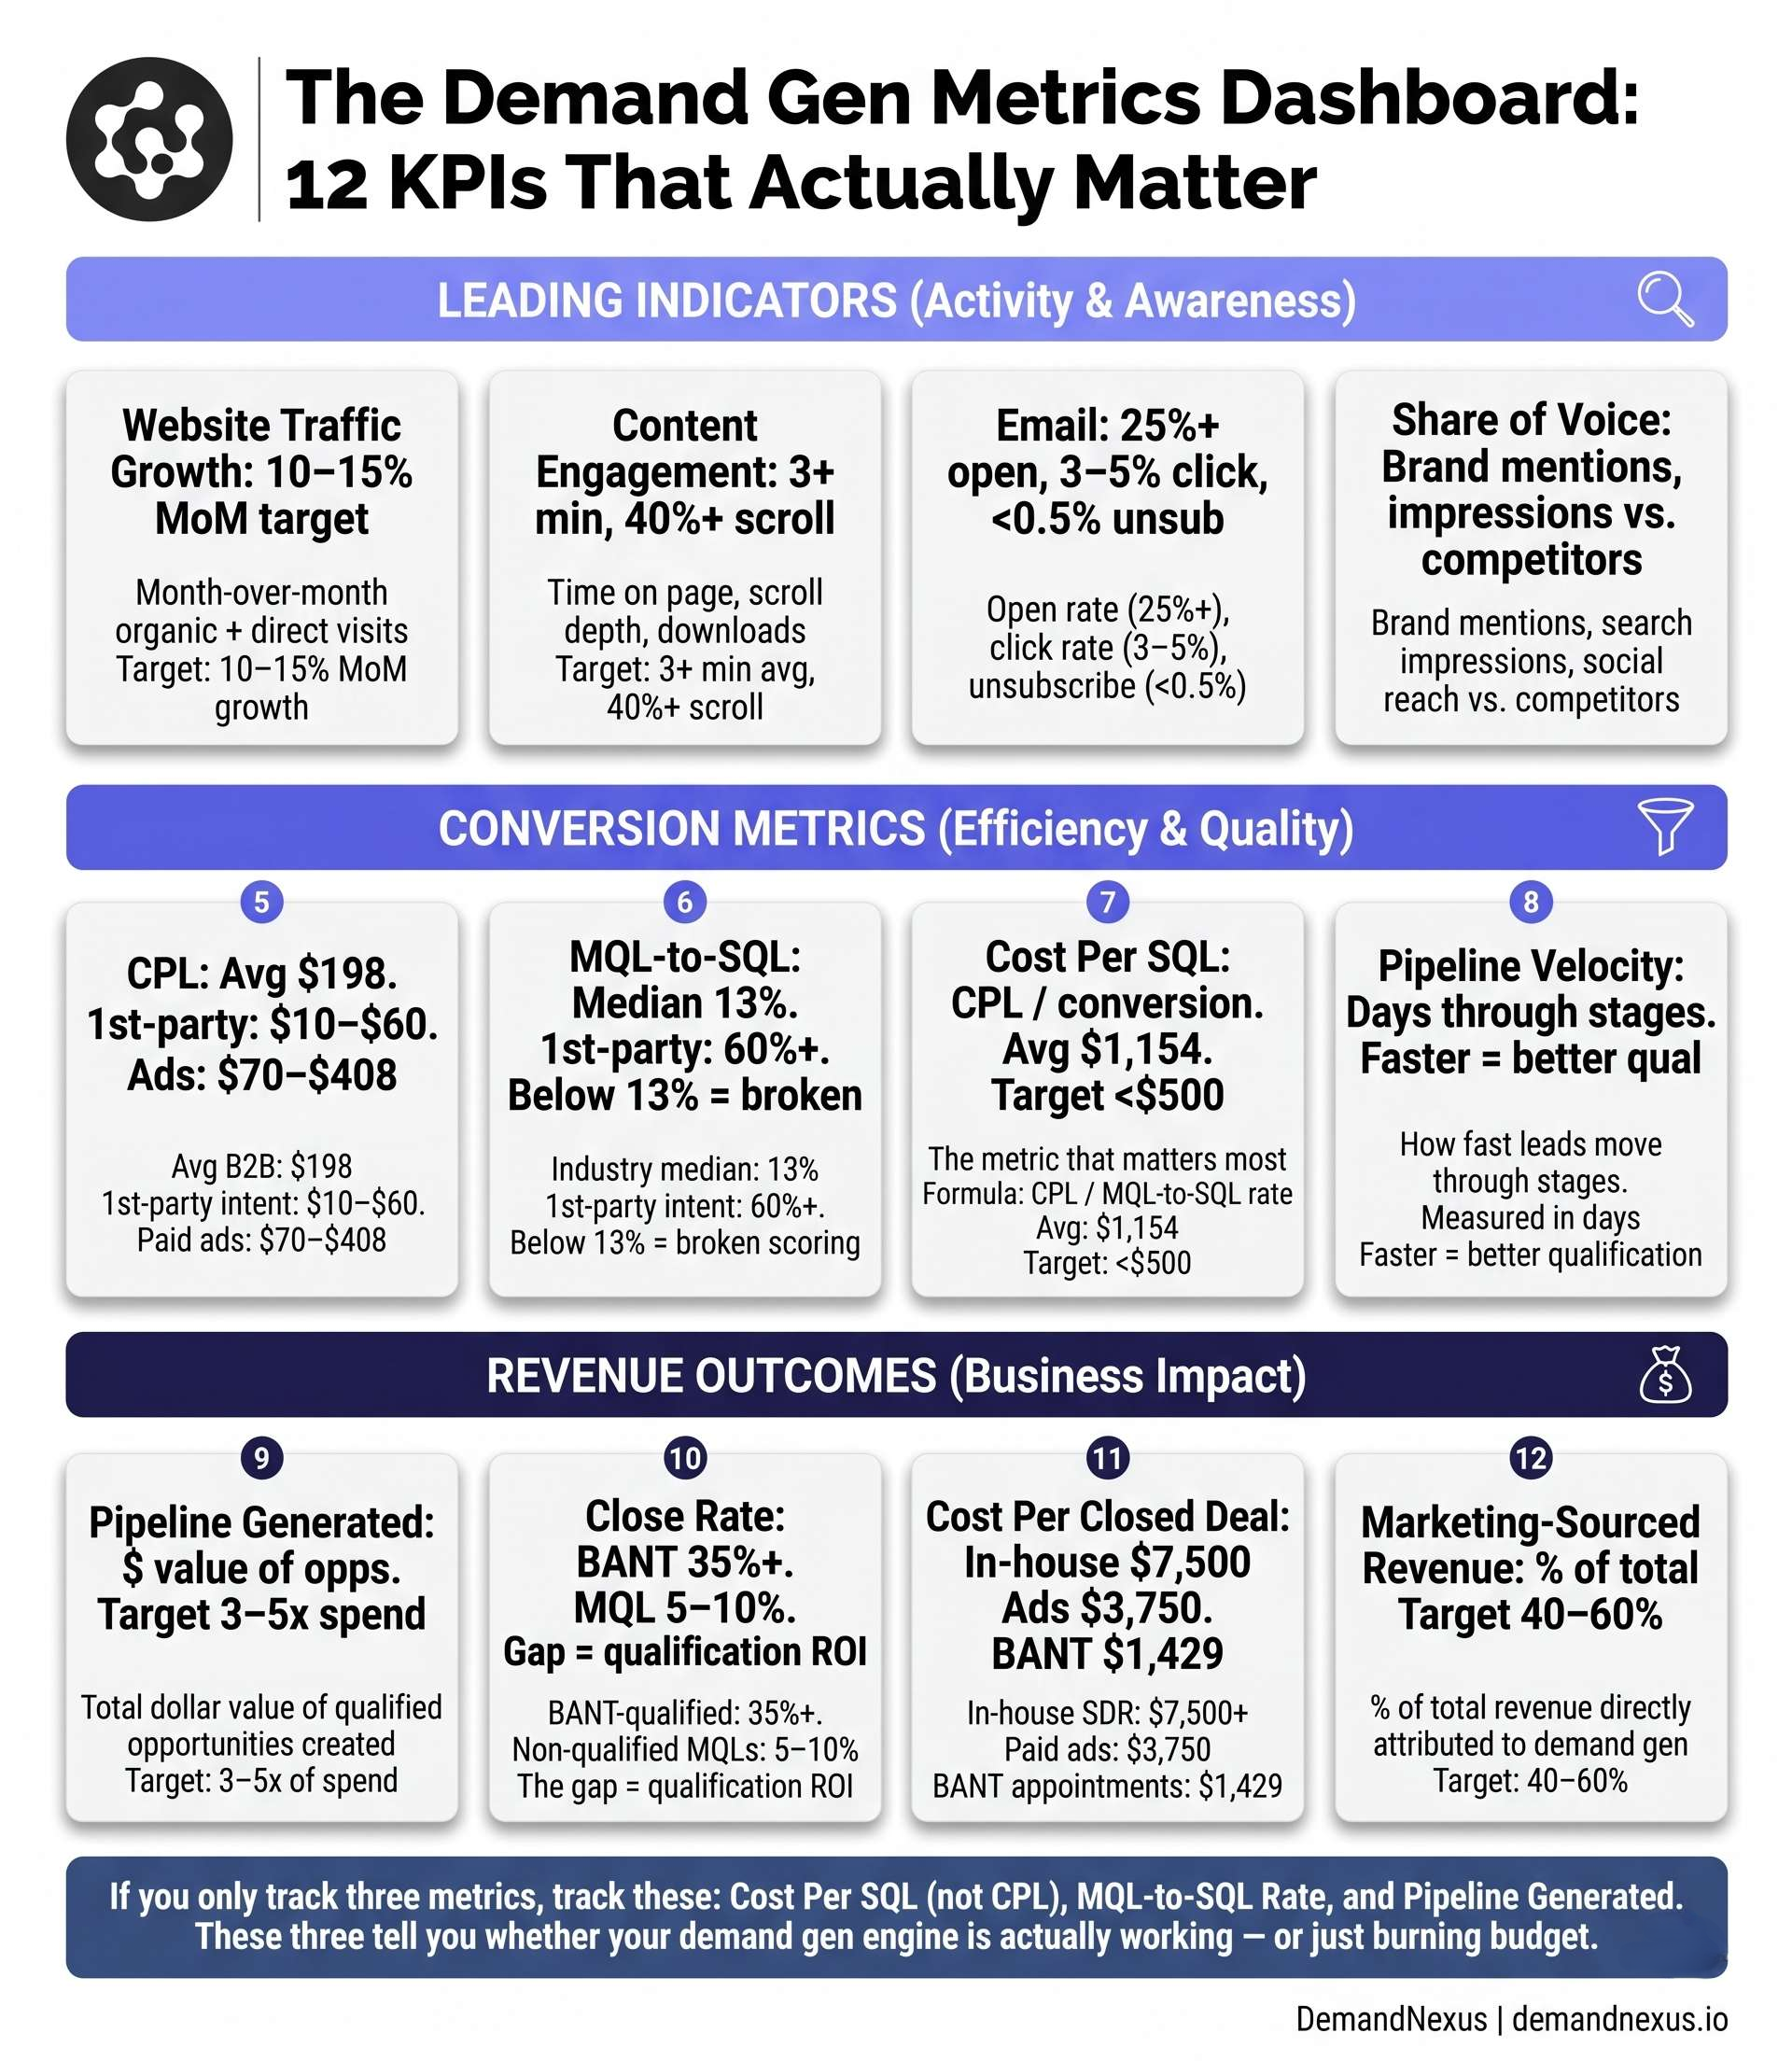
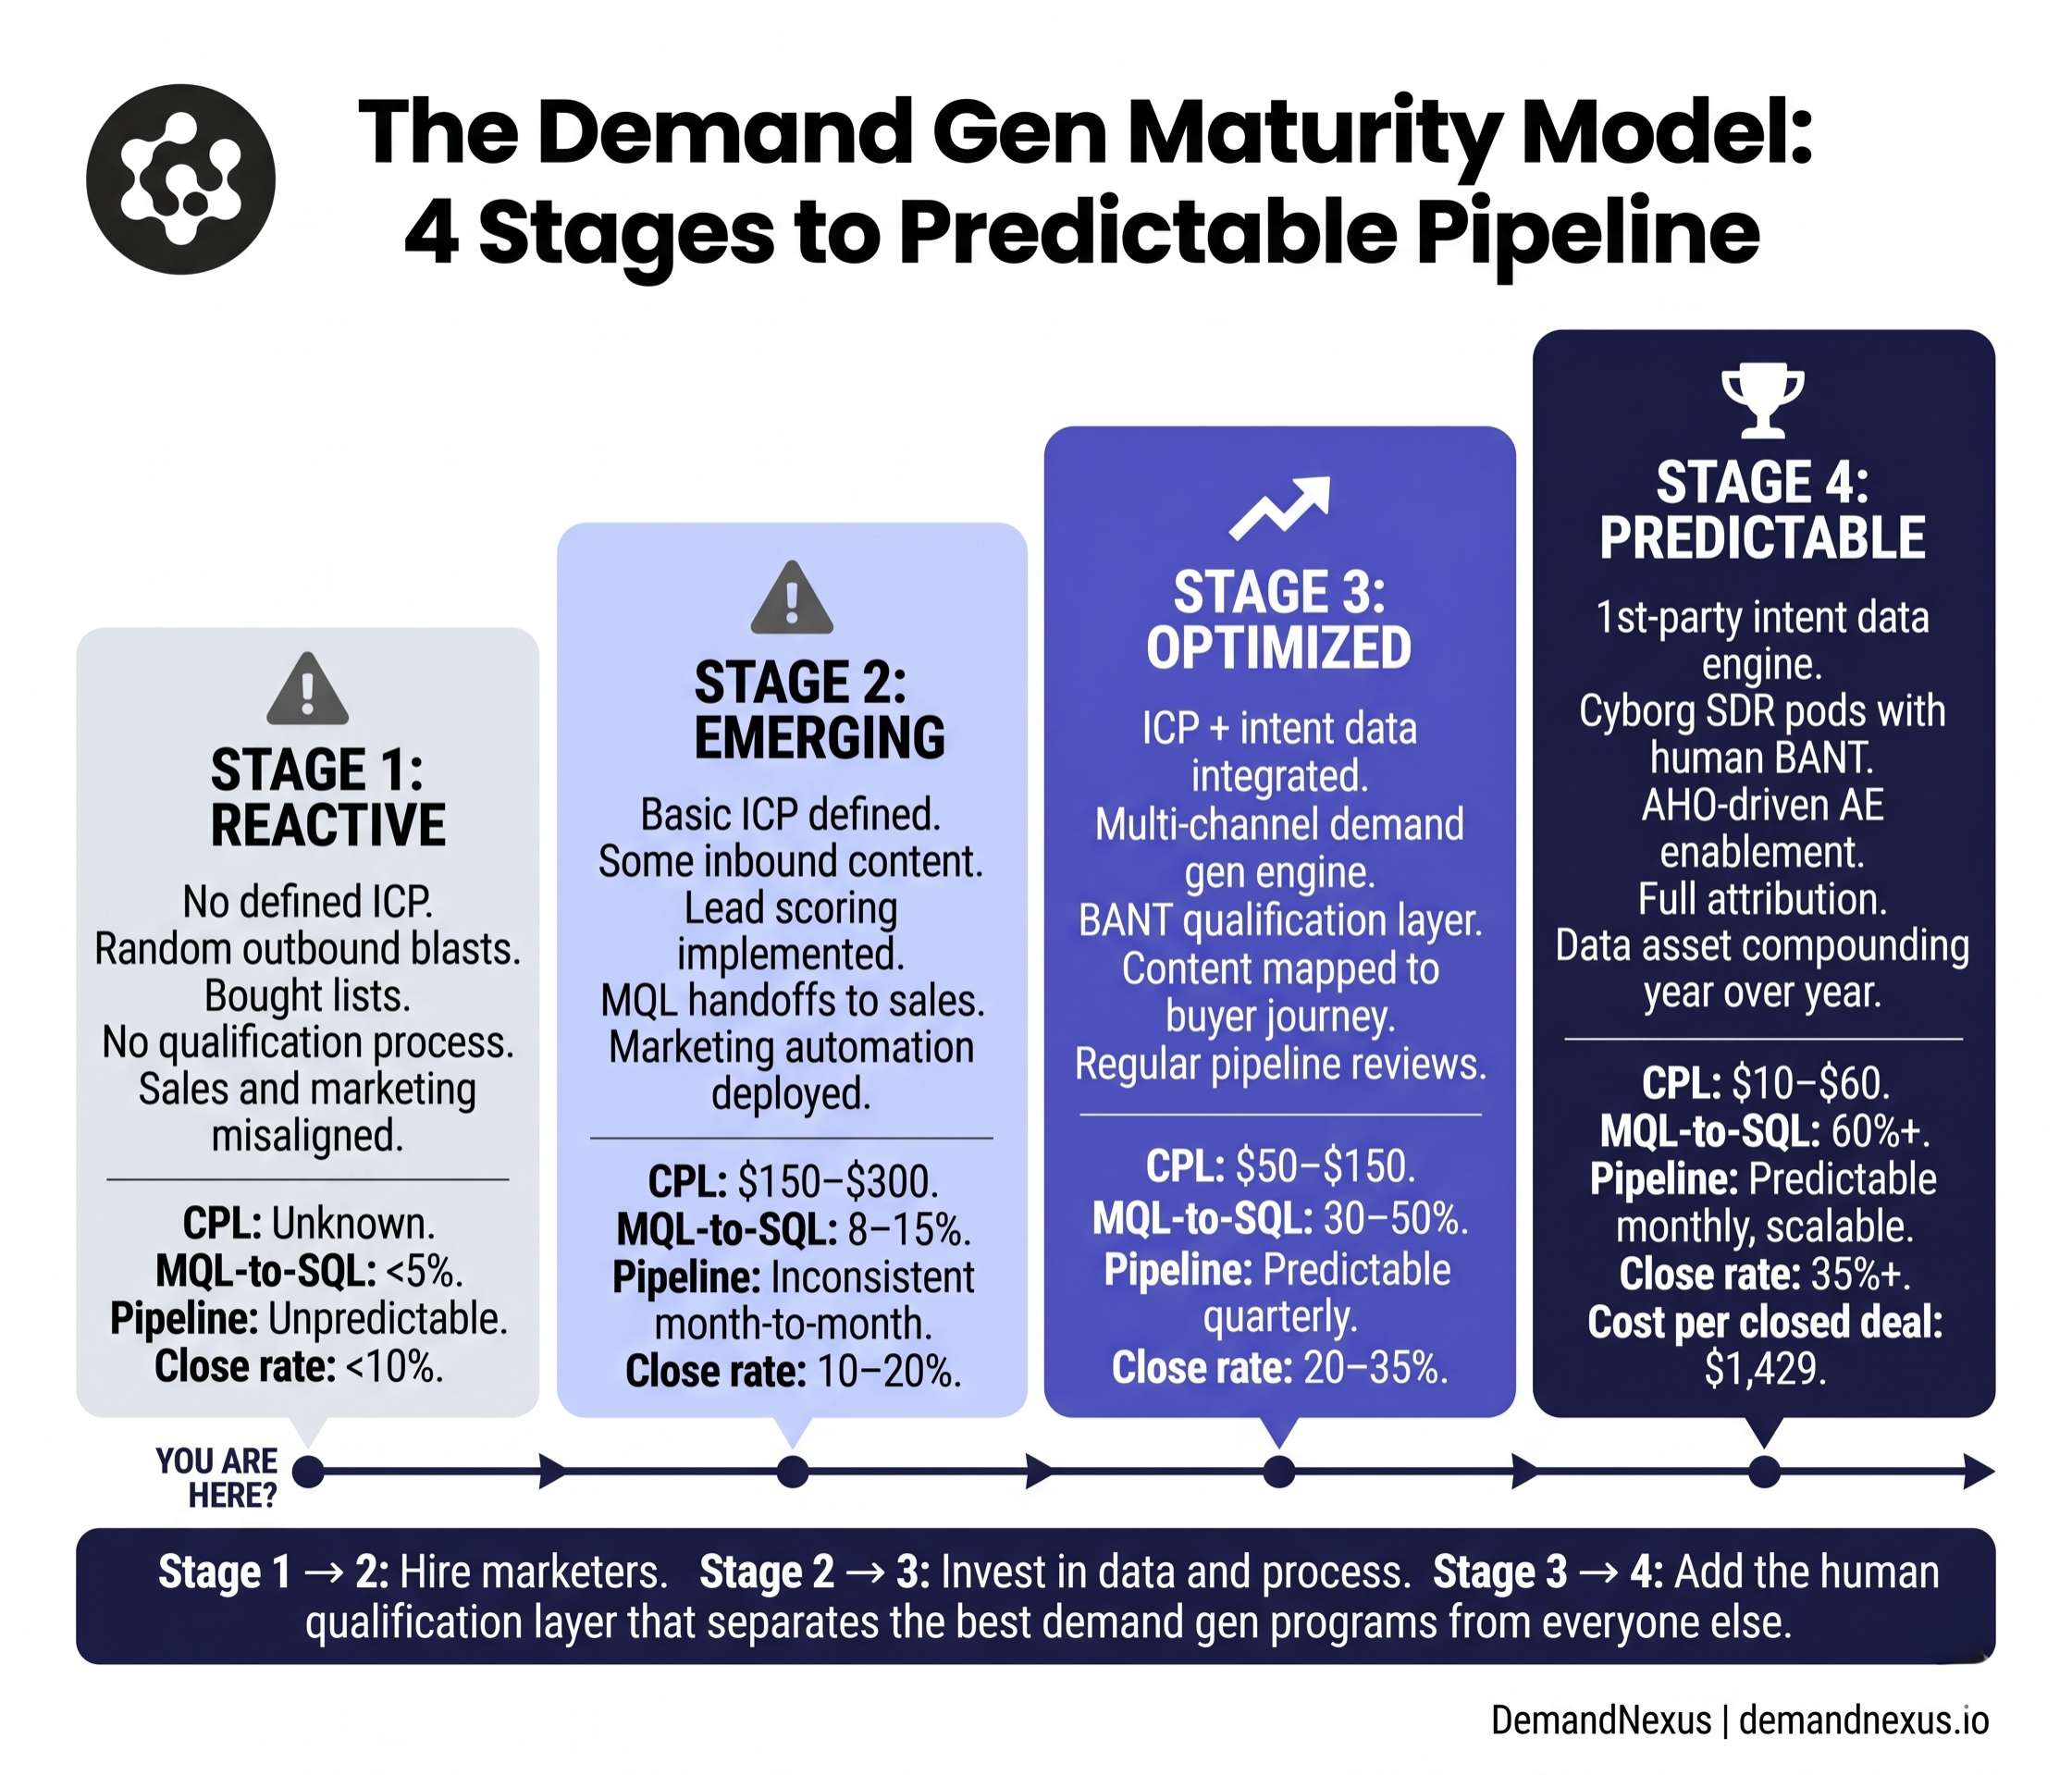
CPL has become increasingly misleading as paid channels have inflated. LinkedIn now averages $408 per lead. Google Ads CPLs are up 70 percent since 2021. A $50 CPL means nothing without knowing the conversion rate to qualified opportunity. A $500 CPL can be more efficient than a $50 CPL if the qualification rate is 10 times higher.
Traffic Volume
Website traffic is a diagnostic metric, not a performance metric. High traffic with low conversion means you have a targeting problem. Low traffic with high conversion means you are winning with the wrong volume. Neither is a destination.

Mid-Funnel Metrics
MQL-to-SQL Conversion Rate
The industry median is 13 percent. If you are below that, your qualification bar is too loose. If you are at 60 percent or higher (where DemandNexus clients using first-party intent typically sit), your qualification is working but your MQL volume might be leaving opportunity on the table.
Meeting Show Rate
Ghost meetings are a hidden cost. An appointment that no-shows has consumed research time, AE prep time, and calendar space without producing anything. Industry average show rates sit at 50 to 70 percent. DemandNexus delivers 90 percent plus show rates because every meeting arrives with an Appointment Handover Sheet documenting exactly why the prospect agreed to the meeting.
Opportunity Creation Rate
What percentage of qualified appointments become documented opportunities in CRM? Anything below 70 percent signals that your qualification bar is still too loose or your AEs are being overly conservative about pipeline creation.
Bottom-Funnel Metrics
Pipeline Velocity
Pipeline velocity is the speed at which deals move from opportunity creation to closed-won. It is calculated as: (number of opportunities x average deal size x win rate) divided by sales cycle length. Improving any of the four variables improves velocity. Demand gen affects three of them: opportunity volume, win rate, and cycle length (through better qualification reducing discovery time).
Opportunity-to-Closed-Won Conversion
Healthy B2B benchmarks run 20 to 30 percent. Enterprise deals with 6-plus month cycles typically sit at 15 to 25 percent. Transactional deals can hit 35 to 50 percent. BANT-verified pipeline converts at 202 percent the rate of non-qualified pipeline.
Average Deal Size
A rising ADS is a healthy demand gen signal. A falling ADS often means you are targeting smaller accounts to hit volume goals. Rising ADS with falling win rate means you are punching above your weight class without the sales enablement to win.
Sales Cycle Length
Sales cycles that stretch are a qualification problem disguised as a sales problem. Pre-qualified pipeline with documented BANT and stakeholder context closes faster because discovery is already done.
Revenue and Efficiency Metrics
Cost per Acquired Customer (CAC)
The CFO-relevant metric. Total sales and marketing spend divided by new customers acquired. CAC alone is meaningless without LTV context.
CAC Payback Period
How many months of customer revenue it takes to recover CAC. Healthy SaaS benchmarks run 12 to 18 months. Above 24 months signals economic problems no demand gen tactic can fix.
LTV-to-CAC Ratio
Lifetime value divided by customer acquisition cost. A ratio of 3:1 is healthy. Below 1:1 means you are losing money on acquisition. Above 5:1 often means you are underinvesting in growth.
Revenue Attribution by Source
What percentage of closed-won revenue traces back to demand gen activity? In mature programs, demand gen typically sources 40 to 70 percent of new revenue. Below 30 percent often means demand gen is under-credited; above 80 percent often means sales enablement is underfunded.
How to Measure Lead Generation ROI
Lead generation ROI is calculated as: (revenue generated from leads – cost of generating leads) divided by cost of generating leads, expressed as a percentage. The honest version requires attribution, time-shifting (a lead generated in Q1 may close in Q3), and realistic assumptions about what revenue would have closed without the demand gen spend.
The practical framework we use at DemandNexus:
- Track every appointment sourced from each channel
- Calculate cost per appointment by channel
- Attribute closed-won revenue back to source appointment
- Calculate revenue per appointment by source
- ROI = (revenue per appointment – cost per appointment) / cost per appointment
Pay-for-performance programs (like the DemandNexus model) simplify this dramatically because cost per appointment is a fixed, known number rather than an allocated blend of retainer and spend.
Demand Generation KPI Dashboard Structure
A well-designed demand gen KPI dashboard has three tiers.
Tier 1: Board-Level (5 metrics)
- Revenue sourced by demand gen
- Pipeline generated
- CAC payback period
- Pipeline coverage ratio (pipeline divided by quota)
- Win rate on demand gen sourced deals
Tier 2: Executive Team (10 metrics)
- All Tier 1 metrics plus:
- Cost per qualified appointment by channel
- SQL conversion rate
- Opportunity-to-closed-won conversion
- Pipeline velocity
- Meeting show rate
Tier 3: Operational Team (20+ metrics)
- All Tier 2 metrics plus channel-level performance, segment performance, content performance, and diagnostic metrics for troubleshooting
The Metrics That DemandNexus Measures Differently
When clients engage DemandNexus, we reframe three metrics. First, we replace MQL volume with BANT-verified appointment count, because MQL volume is not a revenue signal and BANT-verified appointments are. Second, we replace CPL with cost per BANT-verified appointment, because CPL rewards volume and cost per appointment rewards quality. Third, we replace sales accepted leads with sales accepted appointments, because a sales accepted lead is still a lead, while a sales accepted appointment is the beginning of an opportunity.
FAQs
What are the most important demand generation metrics?
The five most important demand gen KPIs in 2026 are cost per BANT-qualified appointment, SQL conversion rate, pipeline velocity, opportunity-to-closed-won conversion rate, and revenue sourced by demand gen. These five metrics predict revenue outcomes. Everything else is diagnostic.
How do you measure demand generation ROI?
Demand generation ROI equals revenue attributed to demand gen sourced pipeline minus demand gen cost, divided by demand gen cost. The key challenges are multi-touch attribution (which touches get credit) and time-shifting (revenue closes in a different period than spend). Pay-for-performance models simplify this by making cost per outcome a fixed, known input.
What is a good MQL to SQL conversion rate?
Industry median MQL to SQL conversion is 13 percent. Anything above 25 percent is strong. Programs using first-party intent data and rigorous BANT qualification routinely hit 60 percent plus. Below 10 percent signals that either qualification criteria are too loose or lead sources are too broad.
What is cost per acquisition in demand generation?
Cost per acquisition (CPA) is total demand gen spend divided by new customers acquired. It differs from cost per lead (CPL) and cost per qualified appointment in that CPA measures closed revenue outcomes, not intermediate funnel stages. CPA is the most CFO-relevant demand gen metric.
How often should demand generation KPIs be reviewed?
Tier 1 board metrics should be reviewed monthly at minimum, quarterly at board level. Tier 2 executive metrics should be reviewed weekly. Tier 3 operational metrics should be monitored daily by the demand gen team. Weekly cadence on qualification and show rate is non-negotiable because these metrics drive everything downstream.